First Busey Results Presentation Deck
2Q23 Earnings Investor Presentation
Pristine Credit Quality
■
■
■
■
■
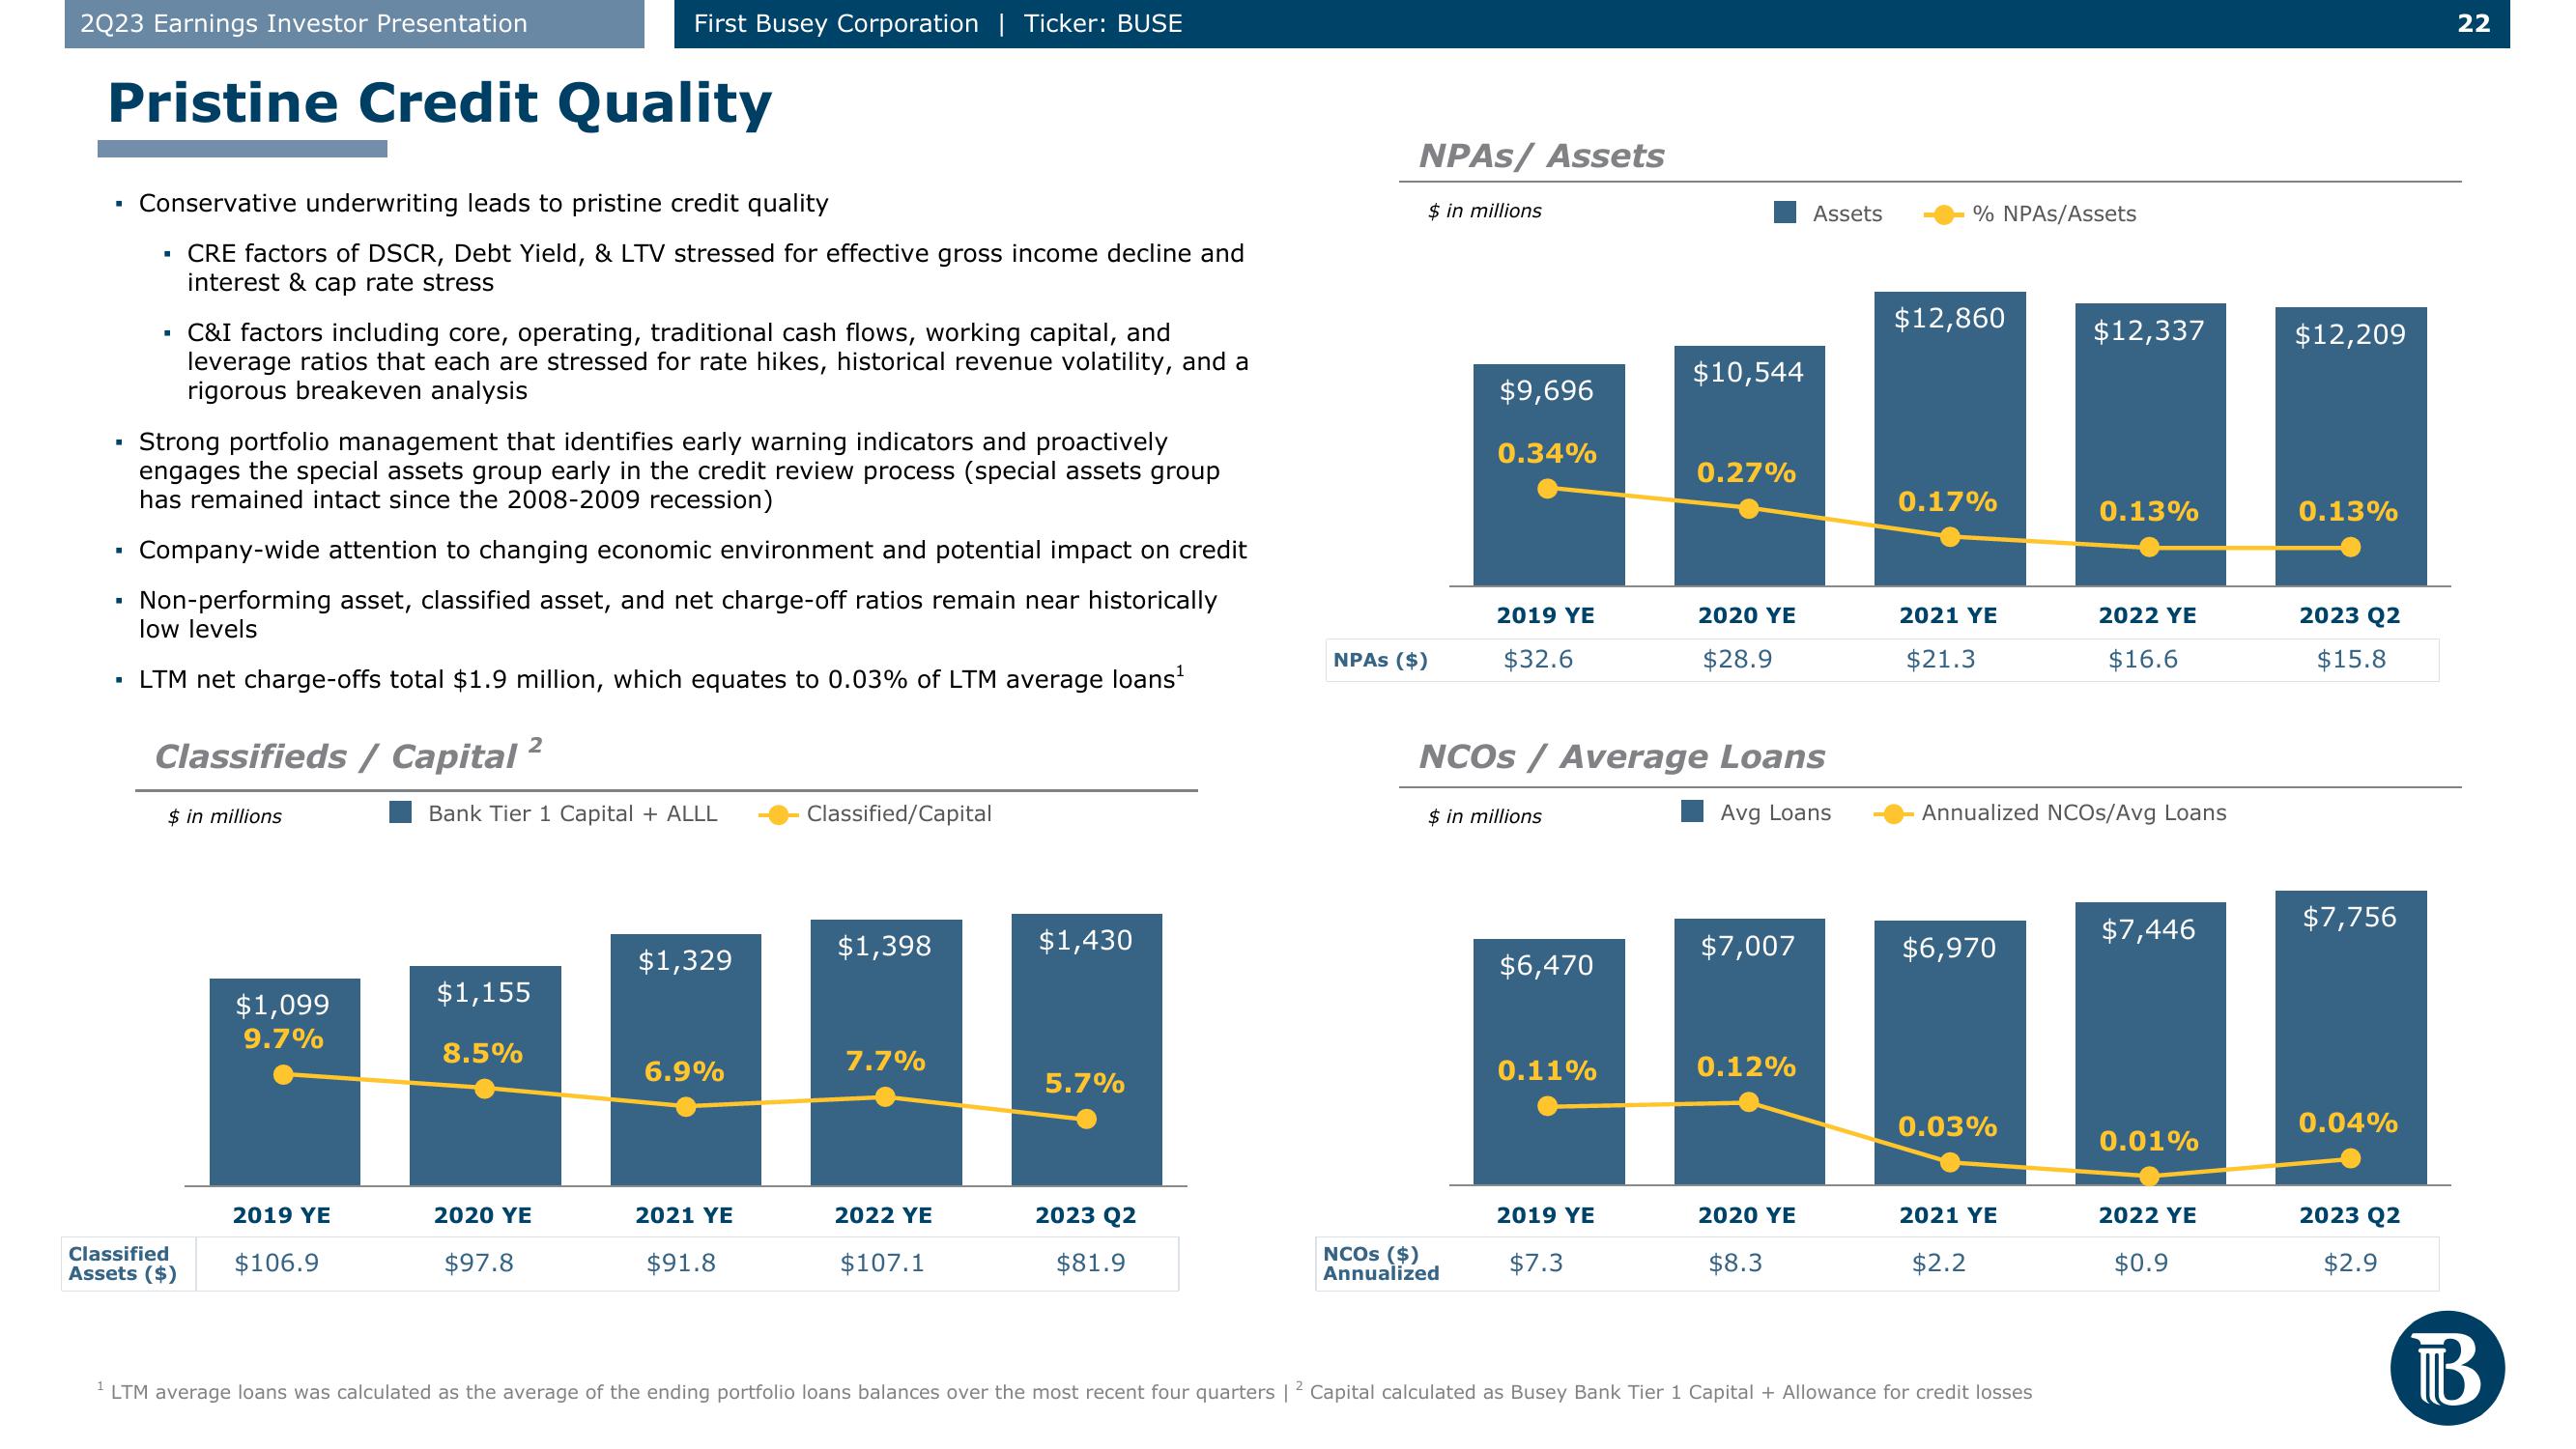
Conservative underwriting leads to pristine credit quality
CRE factors of DSCR, Debt Yield, & LTV stressed for effective gross income decline and
interest & cap rate stress
I
I
C&I factors including core, operating, traditional cash flows, working capital, and
leverage ratios that each are stressed for rate hikes, historical revenue volatility, and a
rigorous breakeven analysis
Strong portfolio management that identifies early warning indicators and proactively
engages the special assets group early in the credit review process (special assets group
has remained intact since the 2008-2009 recession)
Company-wide attention to changing economic environment and potential impact on credit
Non-performing asset, classified asset, and net charge-off ratios remain near historically
low levels
LTM net charge-offs total $1.9 million, which equates to 0.03% of LTM average loans¹
Classifieds / Capital
$ in millions
Classified
Assets ($)
$1,099
9.7%
2019 YE
$106.9
First Busey Corporation | Ticker: BUSE
2
Bank Tier 1 Capital + ALLL
$1,155
8.5%
2020 YE
$97.8
$1,329
6.9%
2021 YE
$91.8
Classified/Capital
$1,398
7.7%
2022 YE
$107.1
$1,430
5.7%
2023 Q2
$81.9
NPAS/ Assets
NPAS ($)
$ in millions
$9,696
0.34%
NCOS ($)
Annualized
2019 YE
$32.6
$ in millions
$6,470
NCOS / Average Loans
Avg Loans
0.11%
2019 YE
$10,544
$7.3
0.27%
2020 YE
$28.9
$7,007
0.12%
2020 YE
Assets
$8.3
% NPAS/Assets
$12,860
0.17%
2021 YE
$21.3
$6,970
0.03%
Annualized NCOS/Avg Loans
2021 YE
$2.2
$12,337
¹ LTM average loans was calculated as the average of the ending portfolio loans balances over the most recent four quarters | 2 Capital calculated as Busey Bank Tier 1 Capital + Allowance for credit losses
0.13%
2022 YE
$16.6
$7,446
0.01%
2022 YE
$0.9
$12,209
0.13%
2023 Q2
$15.8
$7,756
0.04%
2023 Q2
$2.9
22
BView entire presentation