Commercial Metals Company Results Presentation Deck
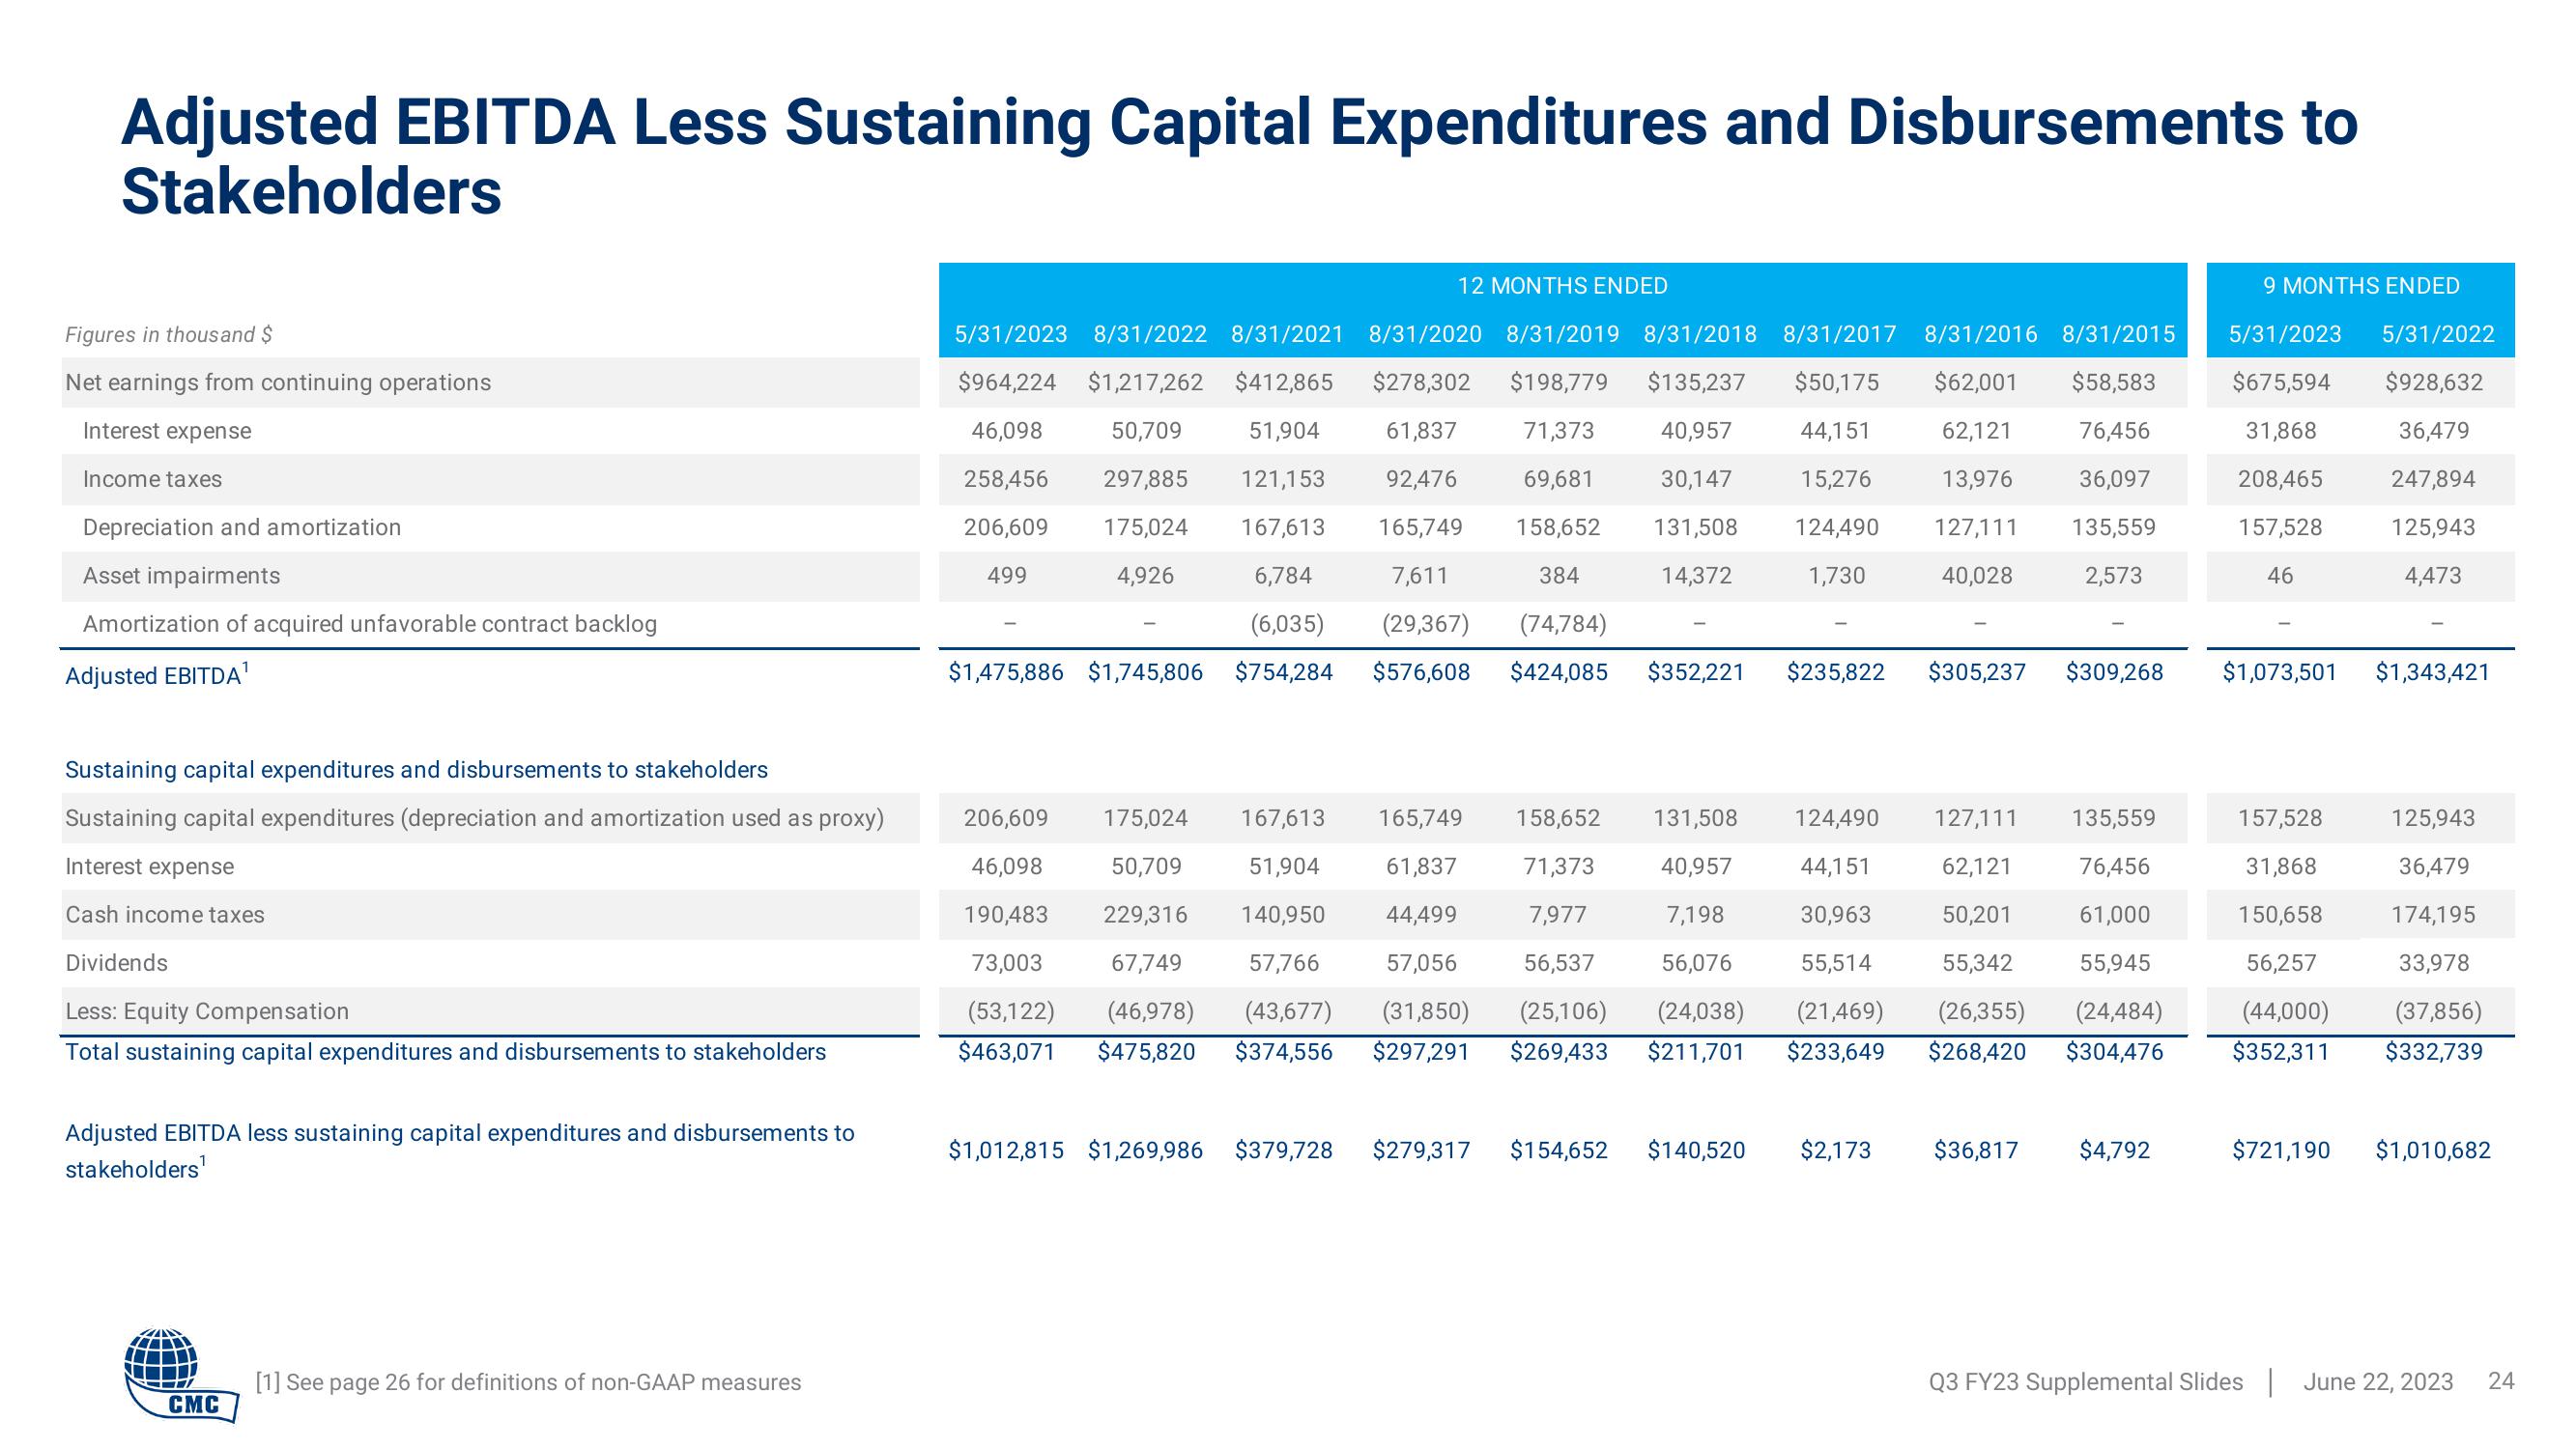
Adjusted EBITDA Less Sustaining Capital Expenditures and Disbursements to
Stakeholders
Figures in thousand $
Net earnings from continuing operations
Interest expense
Income taxes
Depreciation and amortization
Asset impairments
Amortization of acquired unfavorable contract backlog
Adjusted EBITDA¹
Sustaining capital expenditures and disbursements to stakeholders
Sustaining capital expenditures (depreciation and amortization used as proxy)
Interest expense
Cash income taxes
Dividends
Less: Equity Compensation
Total sustaining capital expenditures and disbursements to stakeholders
Adjusted EBITDA less sustaining capital expenditures and disbursements to
stakeholders¹
CMC
[1] See page 26 for definitions of non-GAAP measures
12 MONTHS ENDED
5/31/2023 8/31/2022 8/31/2021 8/31/2020 8/31/2019 8/31/2018 8/31/2017 8/31/2016 8/31/2015
$964,224 $1,217,262 $412,865 $278,302 $198,779 $135,237 $50,175 $62,001 $58,583
46,098
258,456
206,609
50,709 51,904
297,885 121,153
40,957 44,151
30,147 15,276
131,508 124,490
14,372
1,730
61,837 71,373
92,476 69,681
165,749 158,652
7,611
384
(29,367) (74,784)
62,121 76,456
13,976 36,097
127,111 135,559
40,028 2,573
175,024
4,926
167,613
6,784
(6,035)
$754,284
499
$576,608 $424,085 $352,221
$1,475,886 $1,745,806
206,609
158,652
71,373
131,508
40,957
7,198
124,490
44,151
7,977
30,963
175,024 167,613 165,749
46,098 50,709 51,904 61,837
190,483 229,316 140,950 44,499
73,003 67,749 57,766 57,056 56,537 56,076 55,514
(53,122) (46,978) (43,677) (31,850) (25,106) (24,038) (21,469)
$463,071 $475,820 $374,556 $297,291 $269,433 $211,701 $233,649
$1,012,815 $1,269,986 $379,728 $279,317 $154,652
$235,822
$140,520
$2,173
$305,237
$309,268
127,111
62,121
135,559
76,456
61,000
55,945
(26,355) (24,484)
$268,420 $304,476
50,201
55,342
$36,817 $4,792
9 MONTHS ENDED
5/31/2023 5/31/2022
$675,594 $928,632
31,868
36,479
208,465 247,894
157,528 125,943
46
4,473
$1,073,501
157,528
31,868
150,658
56,257
(44,000)
$352,311
$1,343,421
125,943
36,479
174,195
33,978
(37,856)
$332,739
$721,190 $1,010,682
Q3 FY23 Supplemental Slides June 22, 2023
24View entire presentation