Alimentation Couche-Tard Investor Presentation
NON-IFRS MEASURES
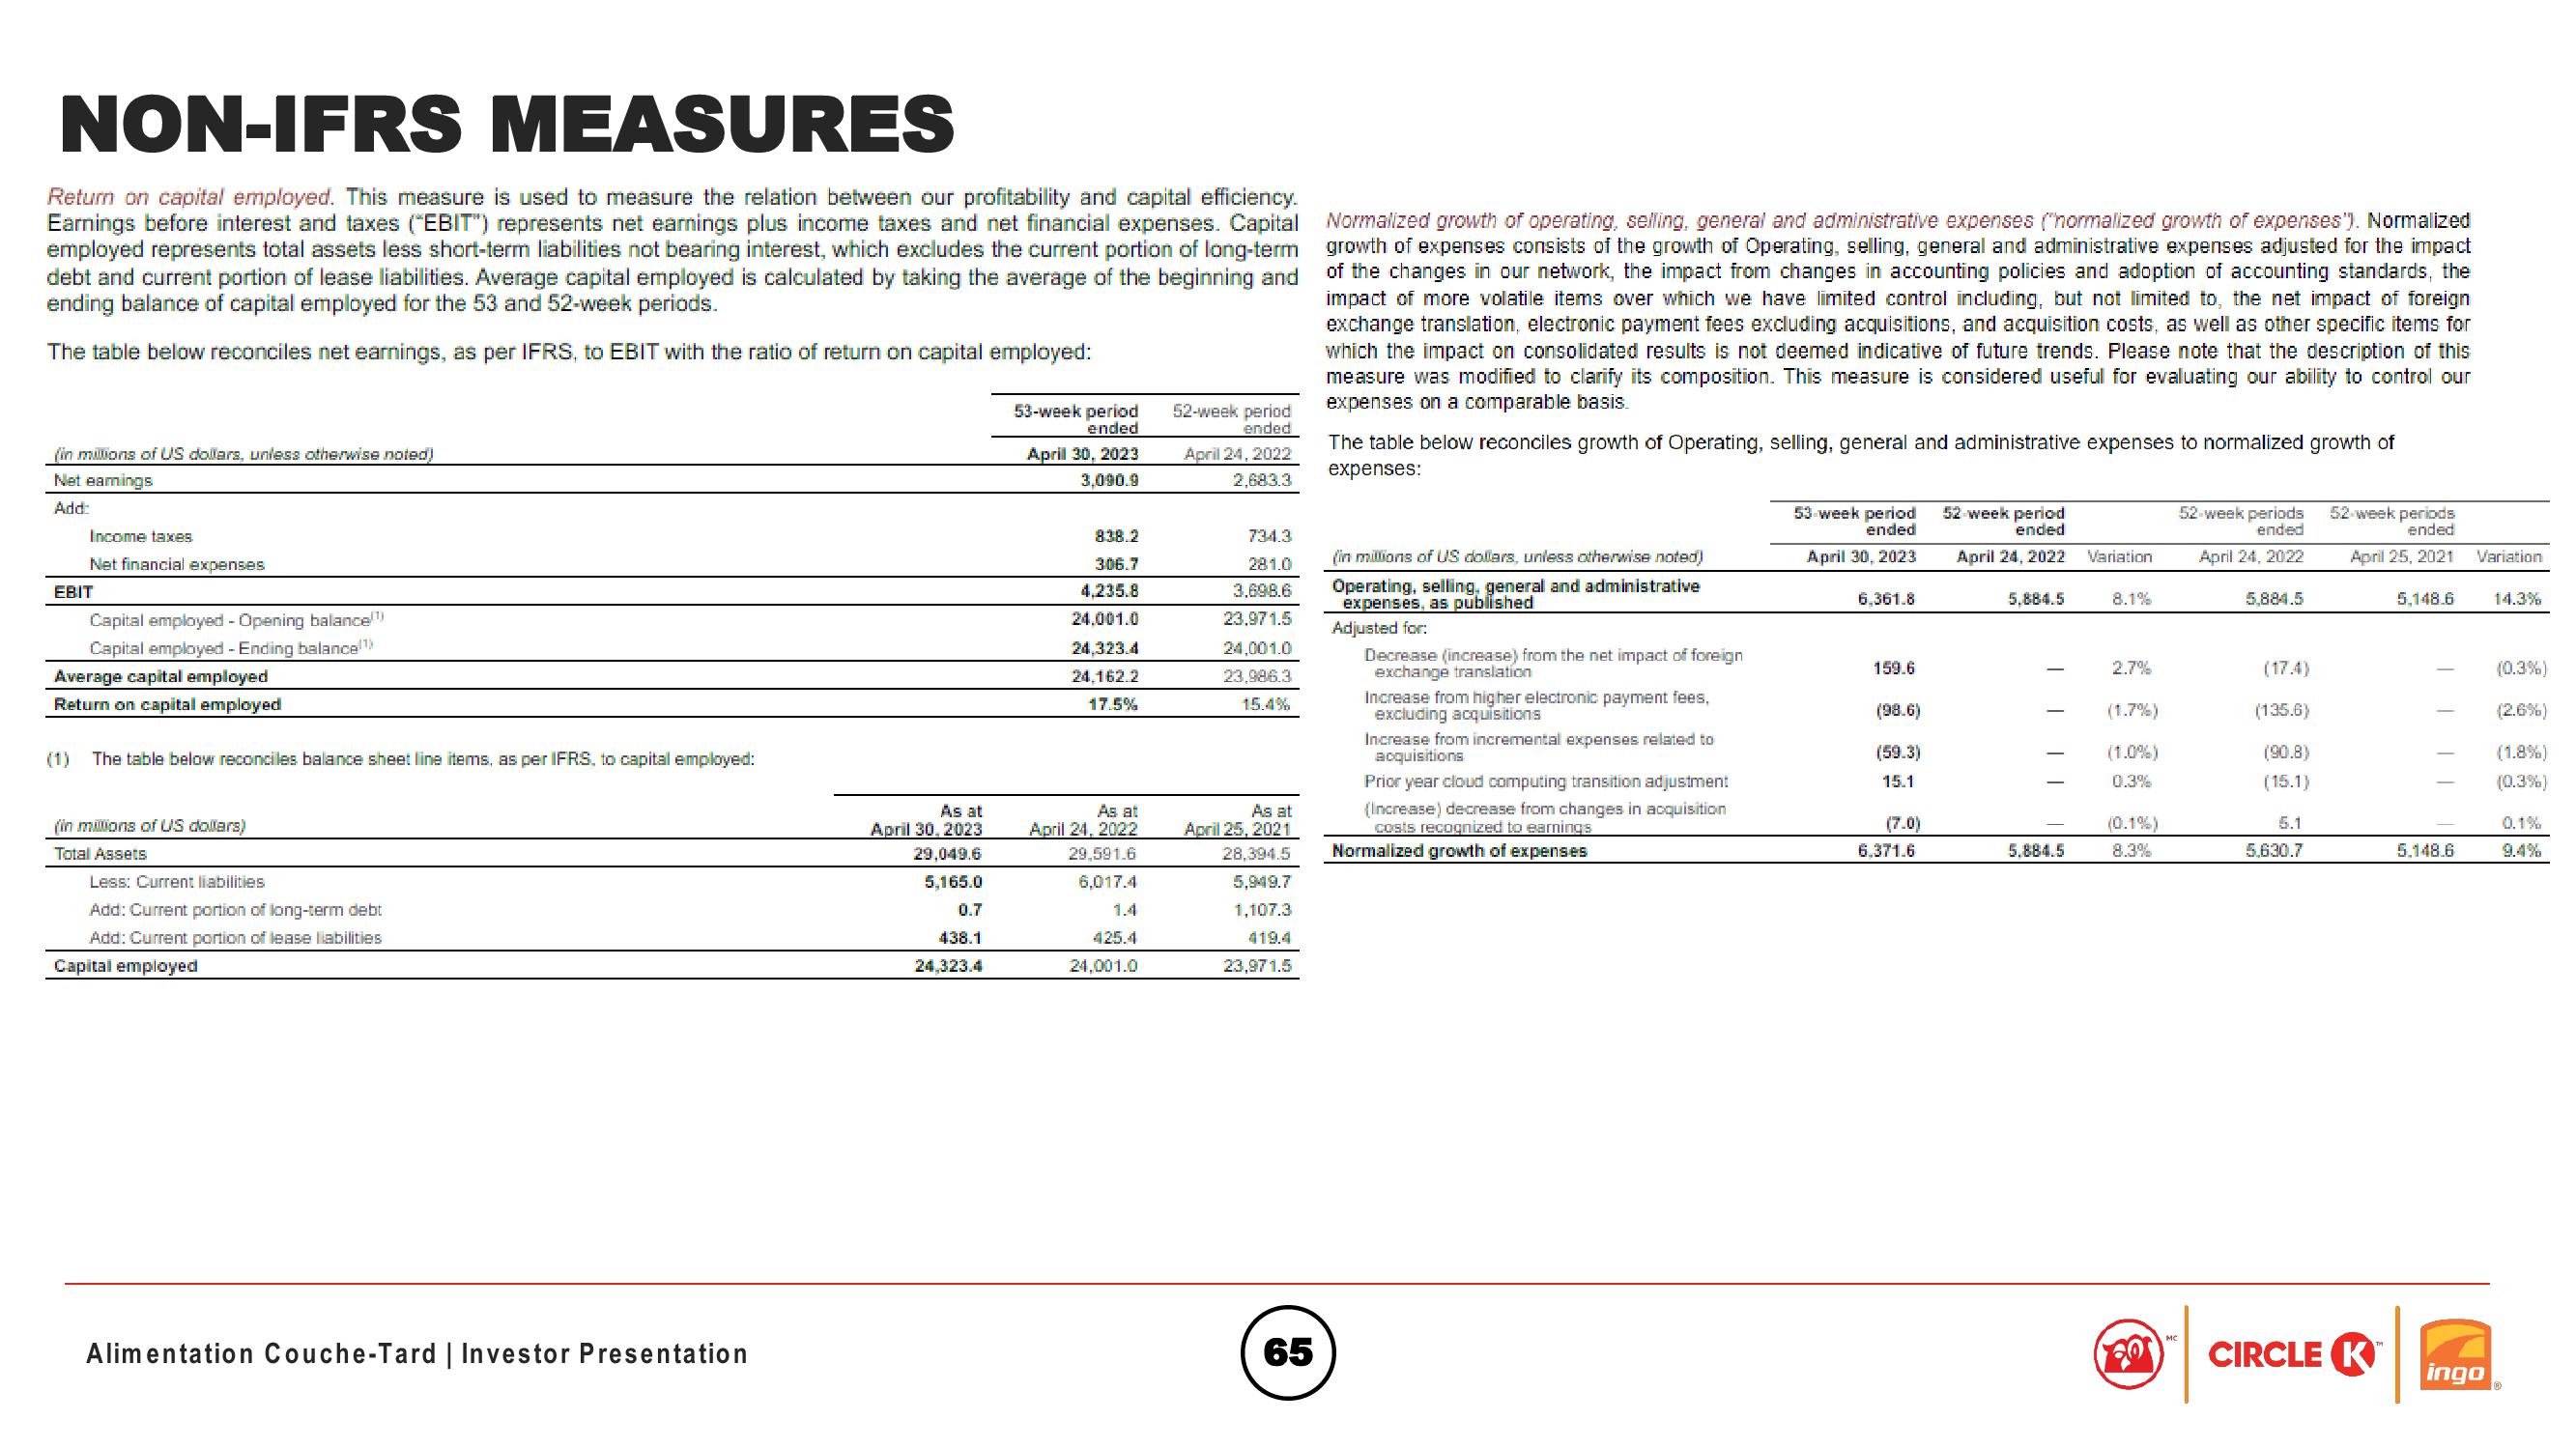
Return on capital employed. This measure is used to measure the relation between our profitability and capital efficiency.
Earnings before interest and taxes ("EBIT") represents net earnings plus income taxes and net financial expenses. Capital
employed represents total assets less short-term liabilities not bearing interest, which excludes the current portion of long-term
debt and current portion of lease liabilities. Average capital employed is calculated by taking the average of the beginning and
ending balance of capital employed for the 53 and 52-week periods.
The table below reconciles net earnings, as per IFRS, to EBIT with the ratio of return on capital employed:
(in millions of US dollars, unless otherwise noted)
Net earnings
Add:
EBIT
Income taxes.
Net financial expenses
Capital employed - Opening balance")
Capital employed - Ending balance(1)
Average capital employed
Return on capital employed
(1)
The table below reconciles balance sheet line items, as per IFRS, to capital employed:
(in millions of US dollars)
Total Assets
Less: Current liabilities
Add: Current portion of long-term debt
Add: Current portion of lease liabilities
Capital employed
52-week period
53-week period
ended
April 30, 2023
3,090.9
ended
April 24, 2022
2,683.3
Normalized growth of operating, selling, general and administrative expenses ("normalized growth of expenses'). Normalized
growth of expenses consists of the growth of Operating, selling, general and administrative expenses adjusted for the impact
of the changes in our network, the impact from changes in accounting policies and adoption of accounting standards, the
impact of more volatile items over which we have limited control including, but not limited to, the net impact of foreign
exchange translation, electronic payment fees excluding acquisitions, and acquisition costs, as well as other specific items for
which the impact on consolidated results is not deemed indicative of future trends. Please note that the description of this
measure was modified to clarify its composition. This measure is considered useful for evaluating our ability to control our
expenses on a comparable basis.
The table below reconciles growth of Operating, selling, general and administrative expenses to normalized growth of
expenses:
52-week periods
ended
April 25, 2021
53-week period
838.2
306.7
734.3
ended
4,235.8
24.001.0
24,323.4
281.0
3.698.6
23,971.5
(in millions of US dollars, unless otherwise noted)
Operating, selling, general and administrative
expenses, as published
Adjusted for:
April 30, 2023
52-week period
ended
April 24, 2022
Variation
52-week periods
ended
April 24, 2022
6,361.8
5.884.5
8.1%
5.884.5
Variation
5,148.6
14.3%
24,162.2
17.5%
24,001.0
23,986.3
Decrease (increase) from the net impact of foreign
exchange translation
159.6
2.7%
(17.4)
(0.3%)
15.4%
Increase from higher electronic payment fees,
excluding acquisitions
(98.6)
(1.7%)
(135.6)
(2.6%)
Increase from incremental expenses related to
acquisitions
(59.3)
(1.0%)
(90.8)
(1.8%)
Prior year cloud computing transition adjustment
15.1
0.3%
(15.1)
(0.3%)
As at
April 30, 2023
29,049.6
5,165.0
0.7
438.1
24,323.4
As at
April 24, 2022
29.591.6
6,017.4
1.4
425.4
As at
April 25, 2021
28,394.5
5,949.7
(Increase) decrease from changes in acquisition
costs recognized to earnings
Normalized growth of expenses
(7.0)
(0.1%)
5.1
0.1%
6.371.6
5.884.5
8.3%
5.630.7
5.148.6
9.4%
1,107.3
419.4
24,001.0
23,971.5
Alimentation Couche-Tard | Investor Presentation
65
59
3
CIRCLE K
ingoView entire presentation