Accel Entertaiment Results Presentation Deck
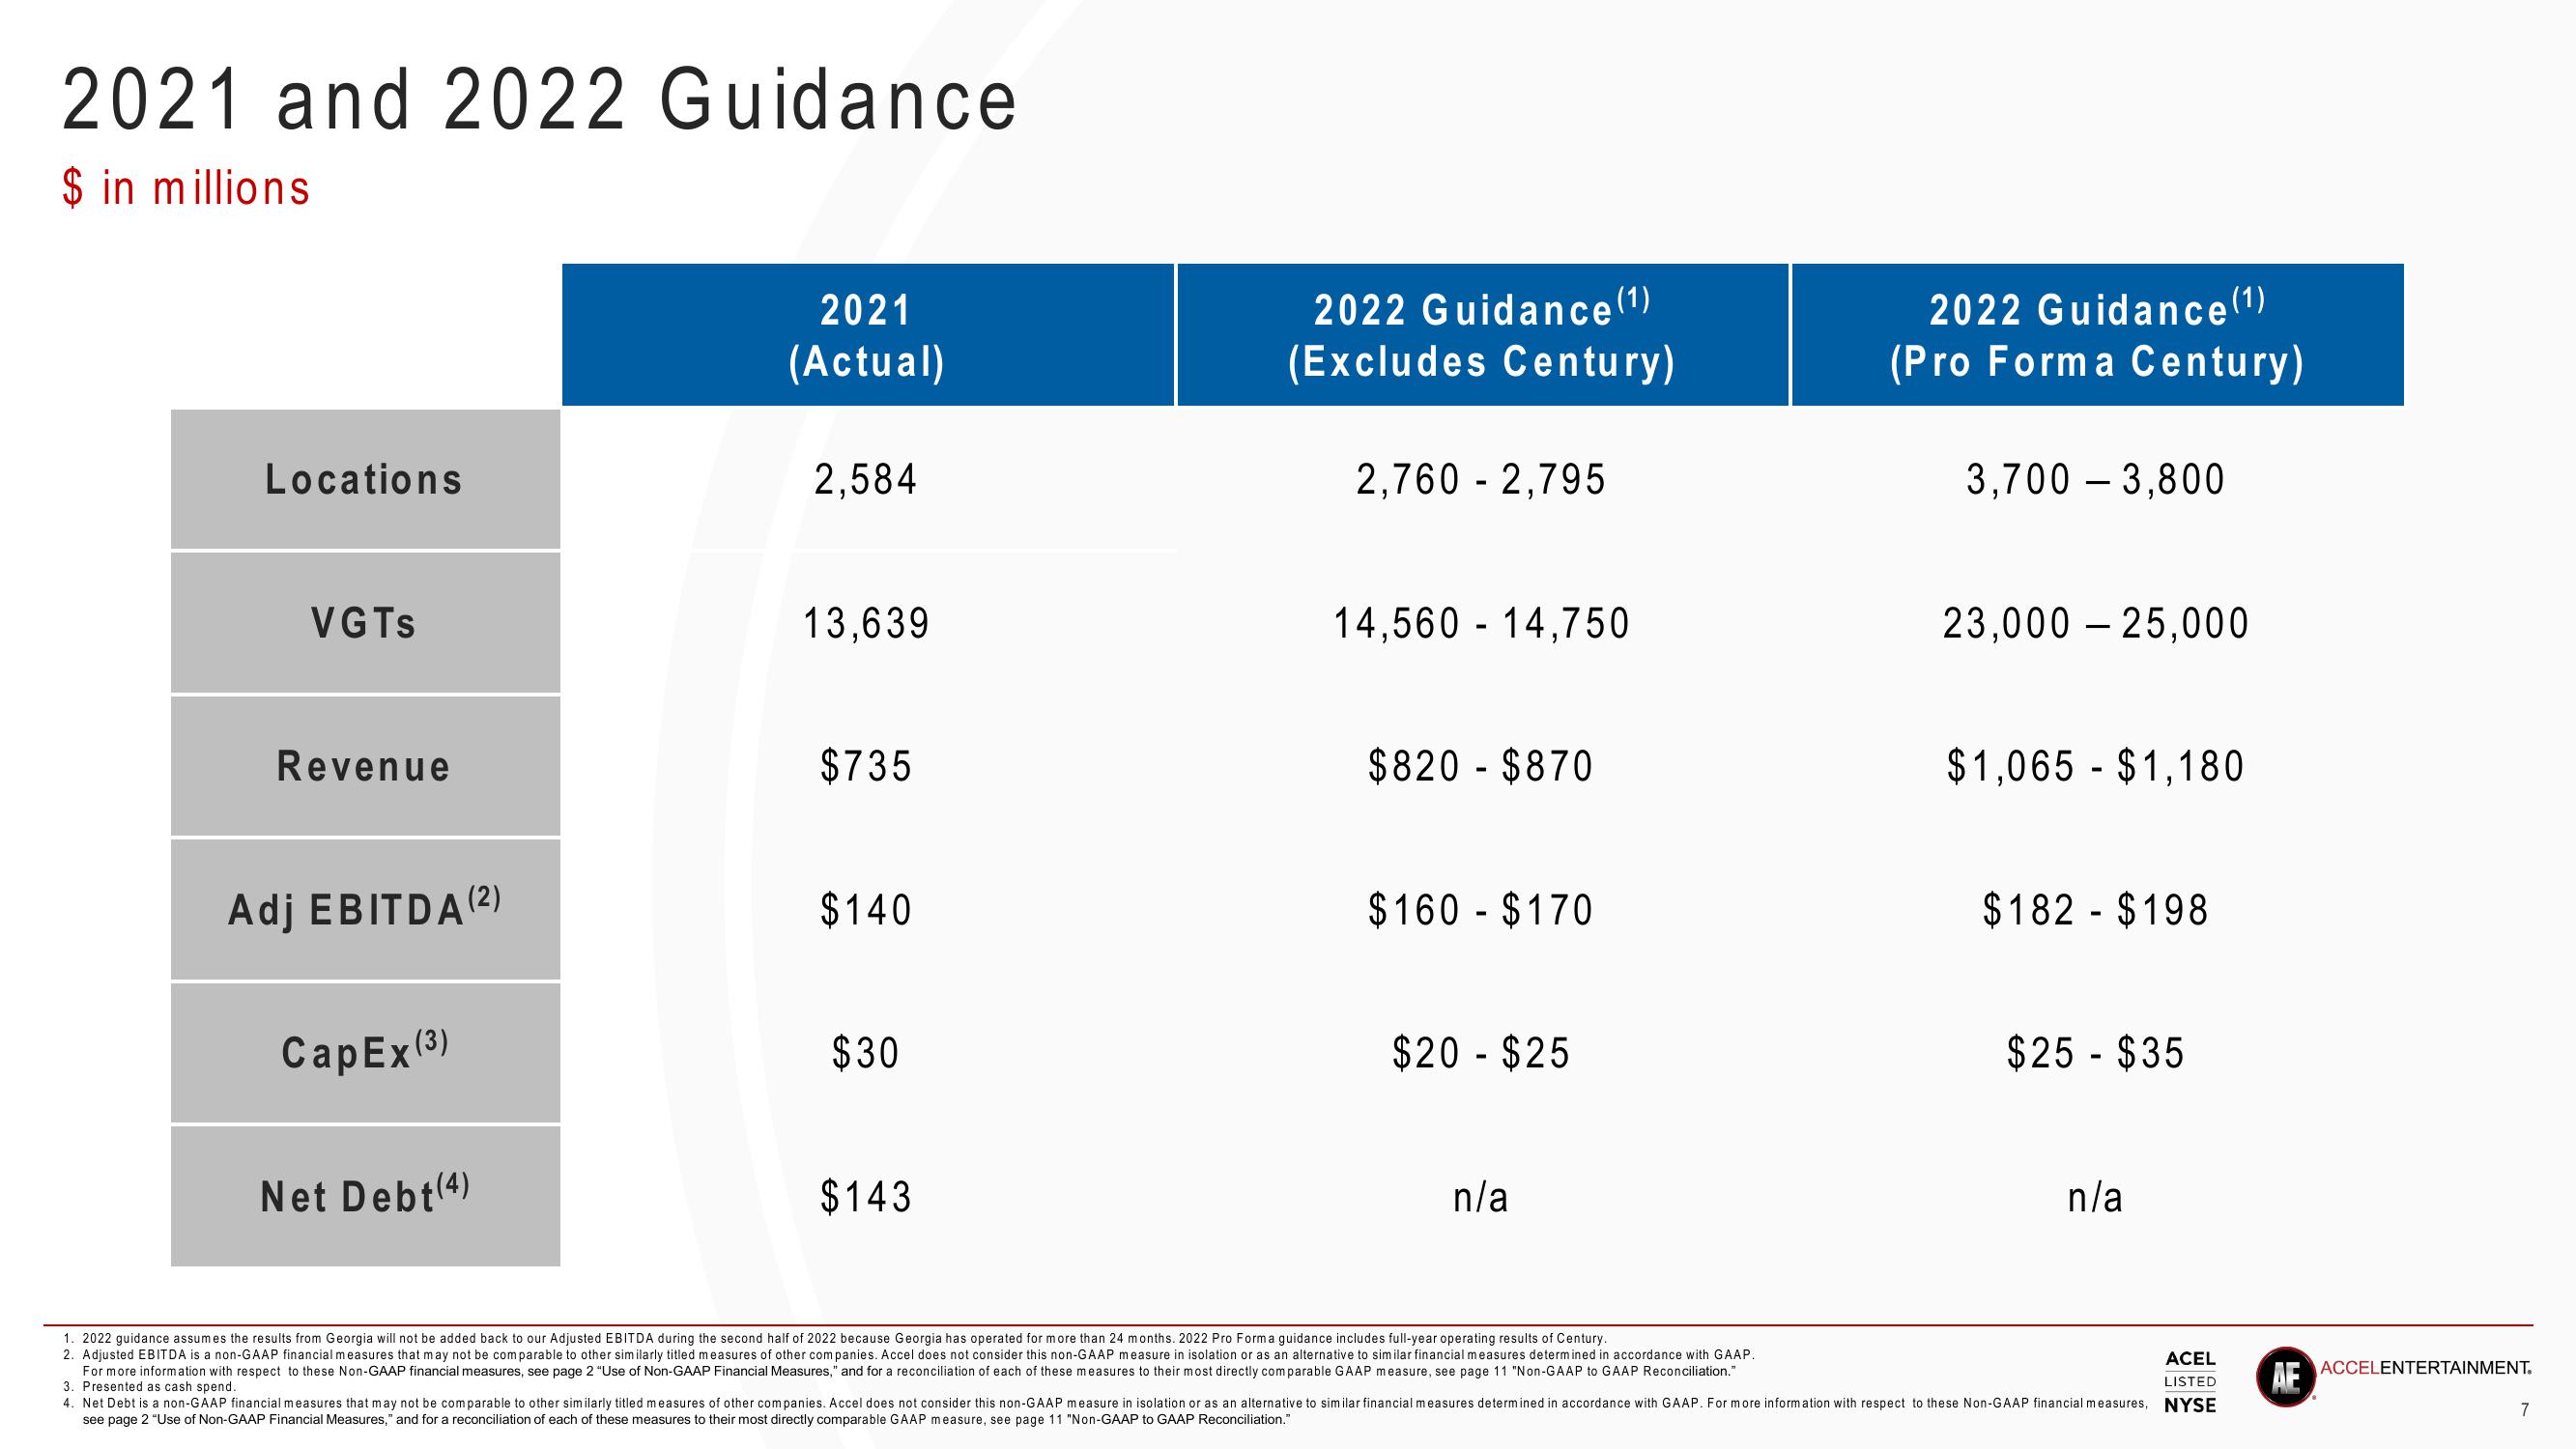
2021 and 2022 Guidance
$ in millions
Locations
VGTS
Revenue
Adj EBITDA (²)
CapEx (3)
Net Debt (4)
2021
(Actual)
2,584
13,639
$735
$140
$30
$143
2022 Guidance (¹)
(Excludes Century)
2,760 - 2,795
14,560 14,750
$820 $870
$160 - $170
$20 - $25
n/a
1. 2022 guidance assumes the results from Georgia will not be added back to our Adjusted EBITDA during the second half of 2022 because Georgia has operated for more than 24 months. 2022 Pro Forma guidance includes full-year operating results of Century.
2. Adjusted EBITDA is a non-GAAP financial measures that may not be comparable to other similarly titled measures of other companies. Accel does not consider this non-GAAP measure in isolation or as an alternative to similar financial measures determined in accordance with GAAP.
For more information with respect to these Non-GAAP financial measures, see page 2 "Use of Non-GAAP Financial Measures," and for a reconciliation of each of these measures to their most directly comparable GAAP measure, see page 11 "Non-GAAP to GAAP Reconciliation."
3. Presented as cash spend.
2022 Guidance (¹)
(Pro Forma Century)
3,700 - 3,800
23,000 25,000
$1,065 $1,180
$182 $198
$25 $35
n/a
ACEL
LISTED
4. Net Debt is a non-GAAP financial measures that may not be comparable to other similarly titled measures of other companies. Accel does not consider this non-GAAP measure in isolation or as an alternative to similar financial measures determined in accordance with GAAP. For more information with respect to these Non-GAAP financial measures, NYSE
see page 2 "Use of Non-GAAP Financial Measures," and for a reconciliation of each of these measures to their most directly comparable GAAP measure, see page 11 "Non-GAAP to GAAP Reconciliation."
AE
ACCELENTERTAINMENT.
7View entire presentation