Phreesia Investor Presentation Deck
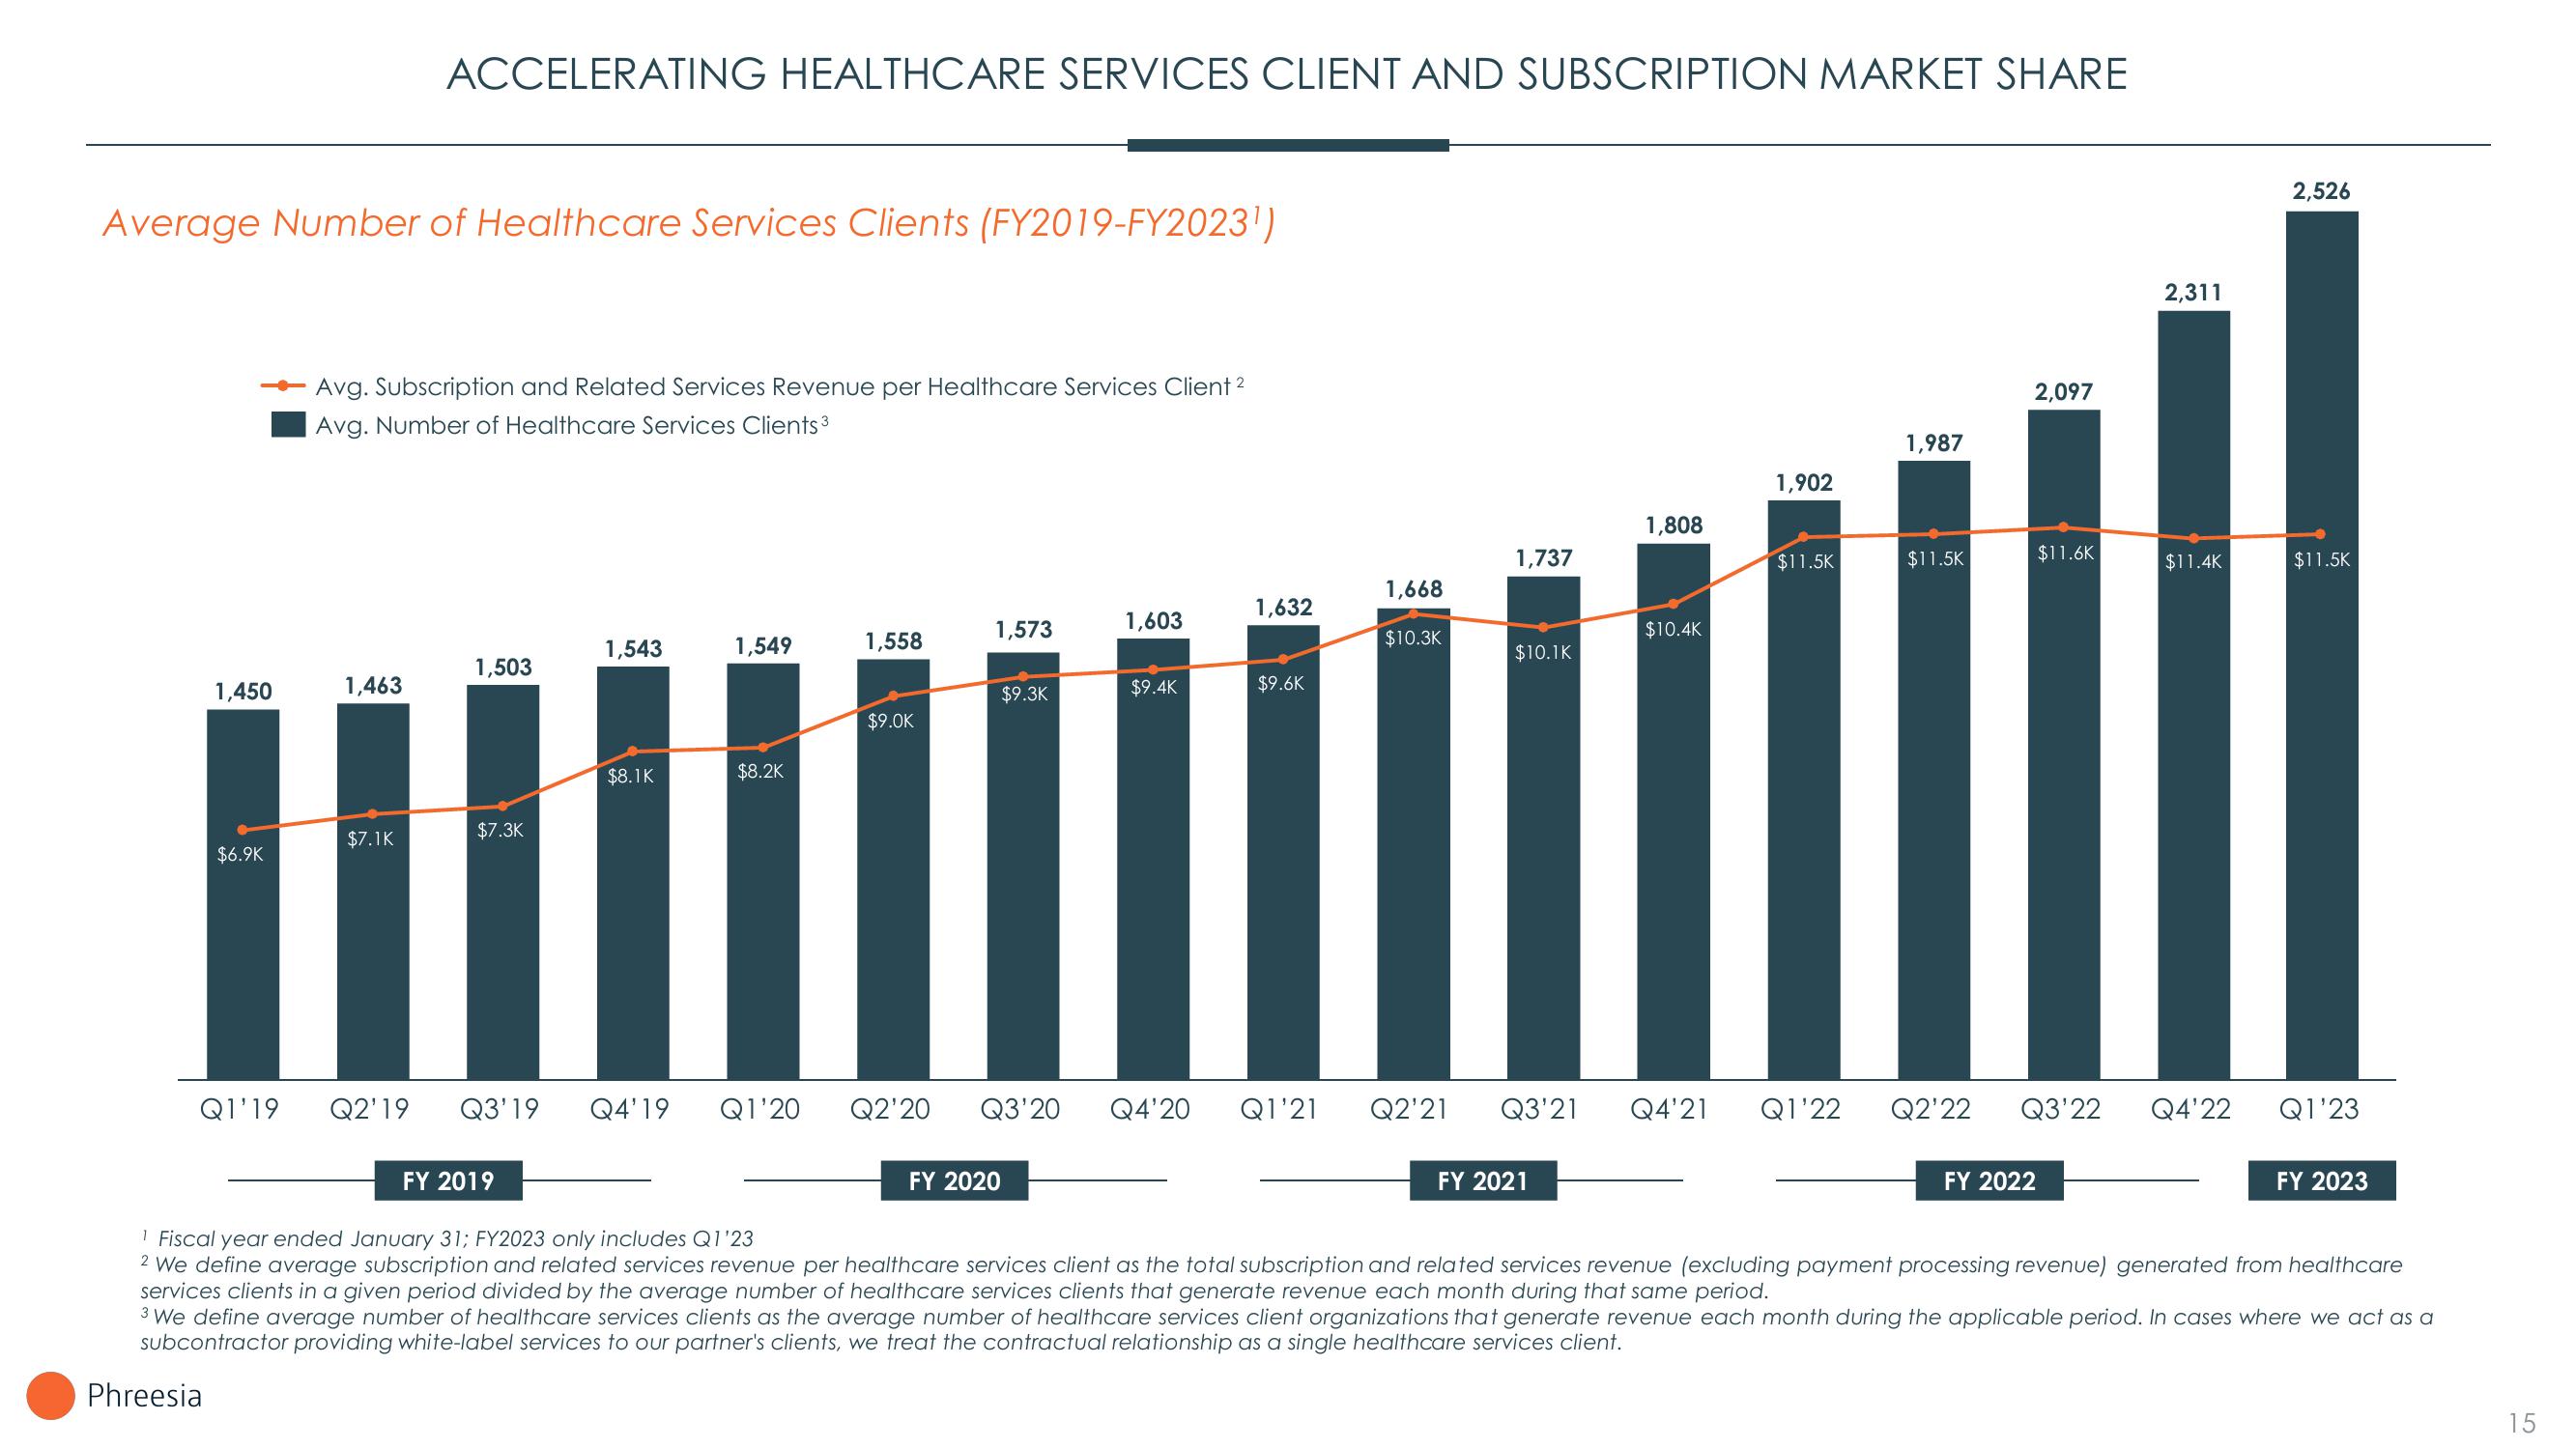
Average Number of Healthcare Services Clients (FY2019-FY2023¹)
1,450
$6.9K
Q1'19
Phreesia
ACCELERATING HEALTHCARE SERVICES CLIENT AND SUBSCRIPTION MARKET SHARE
Avg. Subscription and Related Services Revenue per Healthcare Services Client 2
Avg. Number of Healthcare Services Clients ³
1,463
$7.1K
1,503
$7.3K
1,543
FY 2019
$8.1K
1,549
$8.2K
1,558
$9.0K
1,573
$9.3K
1,603
Q2'19 Q3'19 Q4'19 Q1'20 Q2'20 Q3'20 Q4'20
FY 2020
$9.4K
1,632
$9.6K
1,668
$10.3K
1,737
$10.1K
1,808
FY 2021
$10.4K
1,902
$11.5K
Q1'21 Q2'21 Q3'21 Q4'21 Q1'22
1,987
$11.5K
2,097
$11.6K
FY 2022
2,311
$11.4K
Q2'22 Q3'22 Q4'22
2,526
$11.5K
Q1'23
FY 2023
1 Fiscal year ended January 31; FY2023 only includes Q1'23
2 We define average subscription and related services revenue per healthcare services client as the total subscription and related services revenue (excluding payment processing revenue) generated from healthcare
services clients in a given period divided by the average number of healthcare services clients that generate revenue each month during that same period.
3 We define average number of healthcare services clients as the average number of healthcare services client organizations that generate revenue each month during the applicable period. In cases where we act as a
subcontractor providing white-label services to our partner's clients, we treat the contractual relationship as a single healthcare services client.
15View entire presentation