Hostess Investor Presentation Deck
Hy Consolidated Financial Results
BRANDS
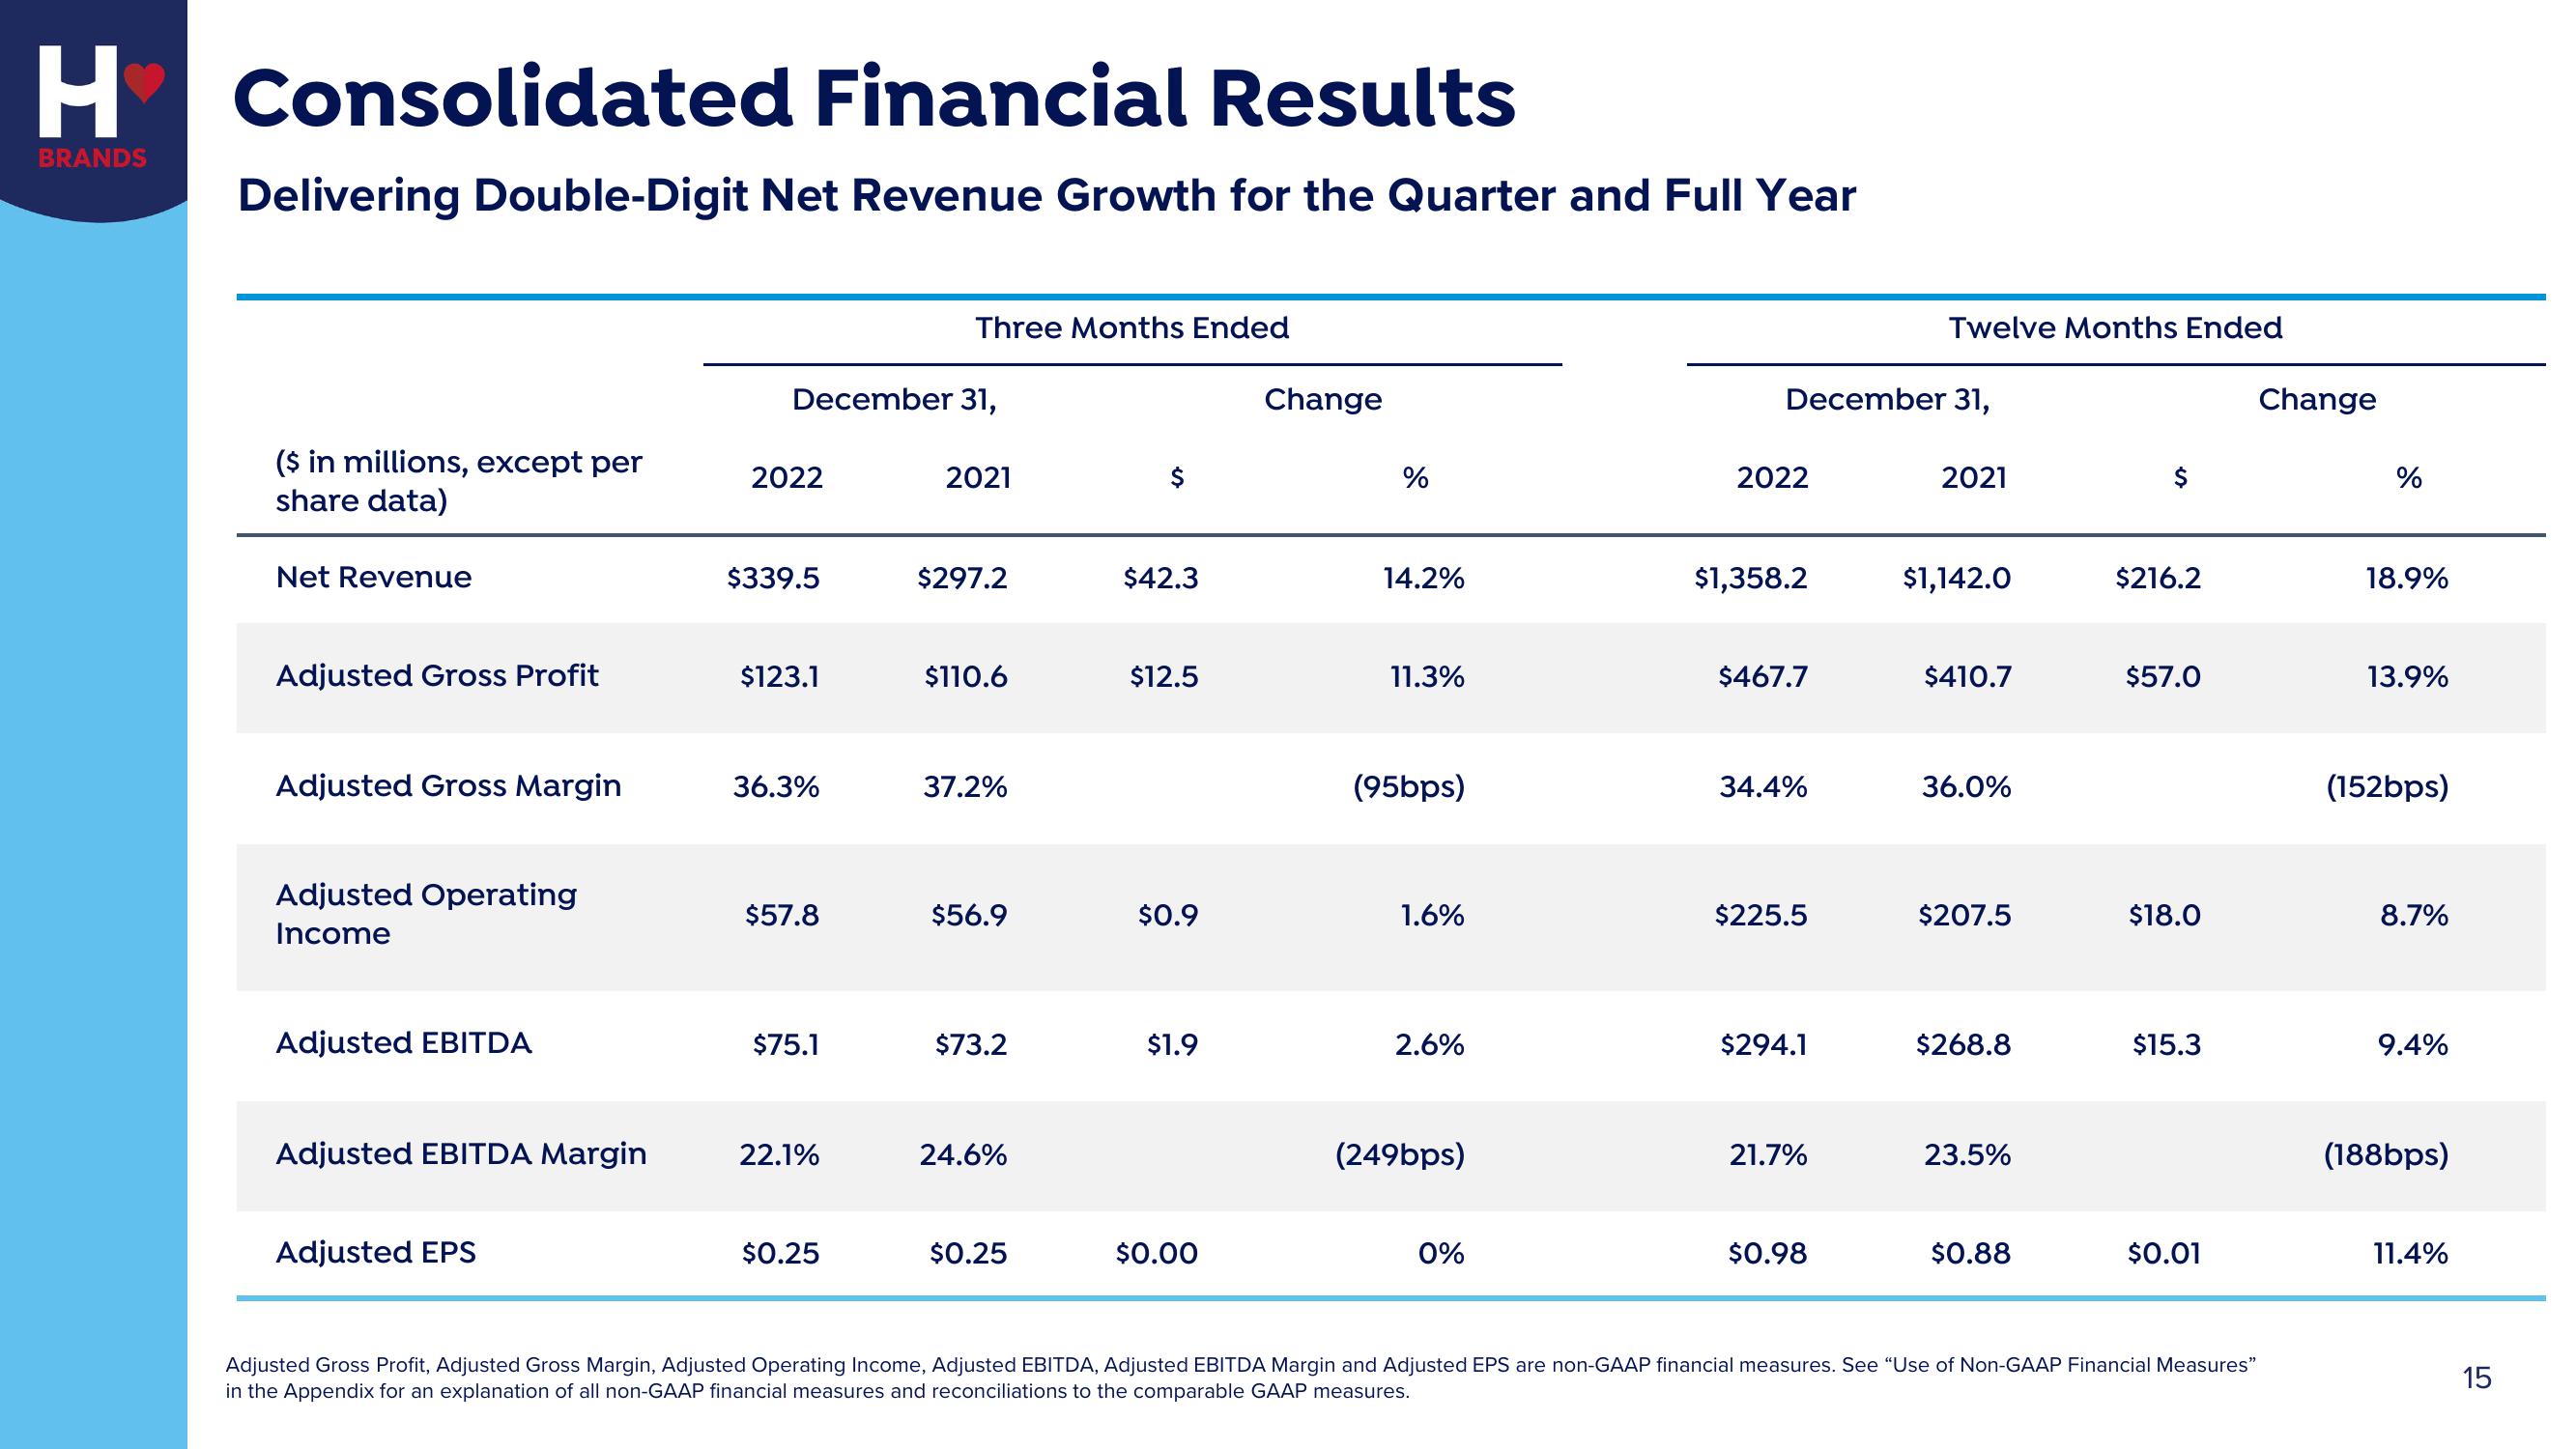
Delivering Double-Digit Net Revenue Growth for the Quarter and Full Year
($ in millions, except per
share data)
Net Revenue
Adjusted Gross Profit
Adjusted Gross Margin
Adjusted Operating
Income
Adjusted EBITDA
Adjusted EBITDA Margin
Adjusted EPS
December 31,
2022
$339.5
$123.1
36.3%
$57.8
$75.1
22.1%
Three Months Ended
$0.25
2021
$297.2
$110.6
37.2%
$56.9
$73.2
24.6%
$0.25
$
$42.3
$12.5
$0.9
$1.9
$0.00
Change
%
14.2%
11.3%
(95bps)
1.6%
2.6%
(249bps)
0%
December 31,
2022
$1,358.2
$467.7
34.4%
$225.5
$294.1
21.7%
Twelve Months Ended
$0.98
2021
$1,142.0
$410.7
36.0%
$207.5
$268.8
23.5%
$0.88
$
$216.2
$57.0
$18.0
$15.3
$0.01
Adjusted Gross Profit, Adjusted Gross Margin, Adjusted Operating Income, Adjusted EBITDA, Adjusted EBITDA Margin and Adjusted EPS are non-GAAP financial measures. See "Use of Non-GAAP Financial Measures"
in the Appendix for an explanation of all non-GAAP financial measures and reconciliations to the comparable GAAP measures.
Change
%
18.9%
13.9%
(152bps)
8.7%
9.4%
(188bps)
11.4%
15View entire presentation