Allego SPAC Presentation Deck
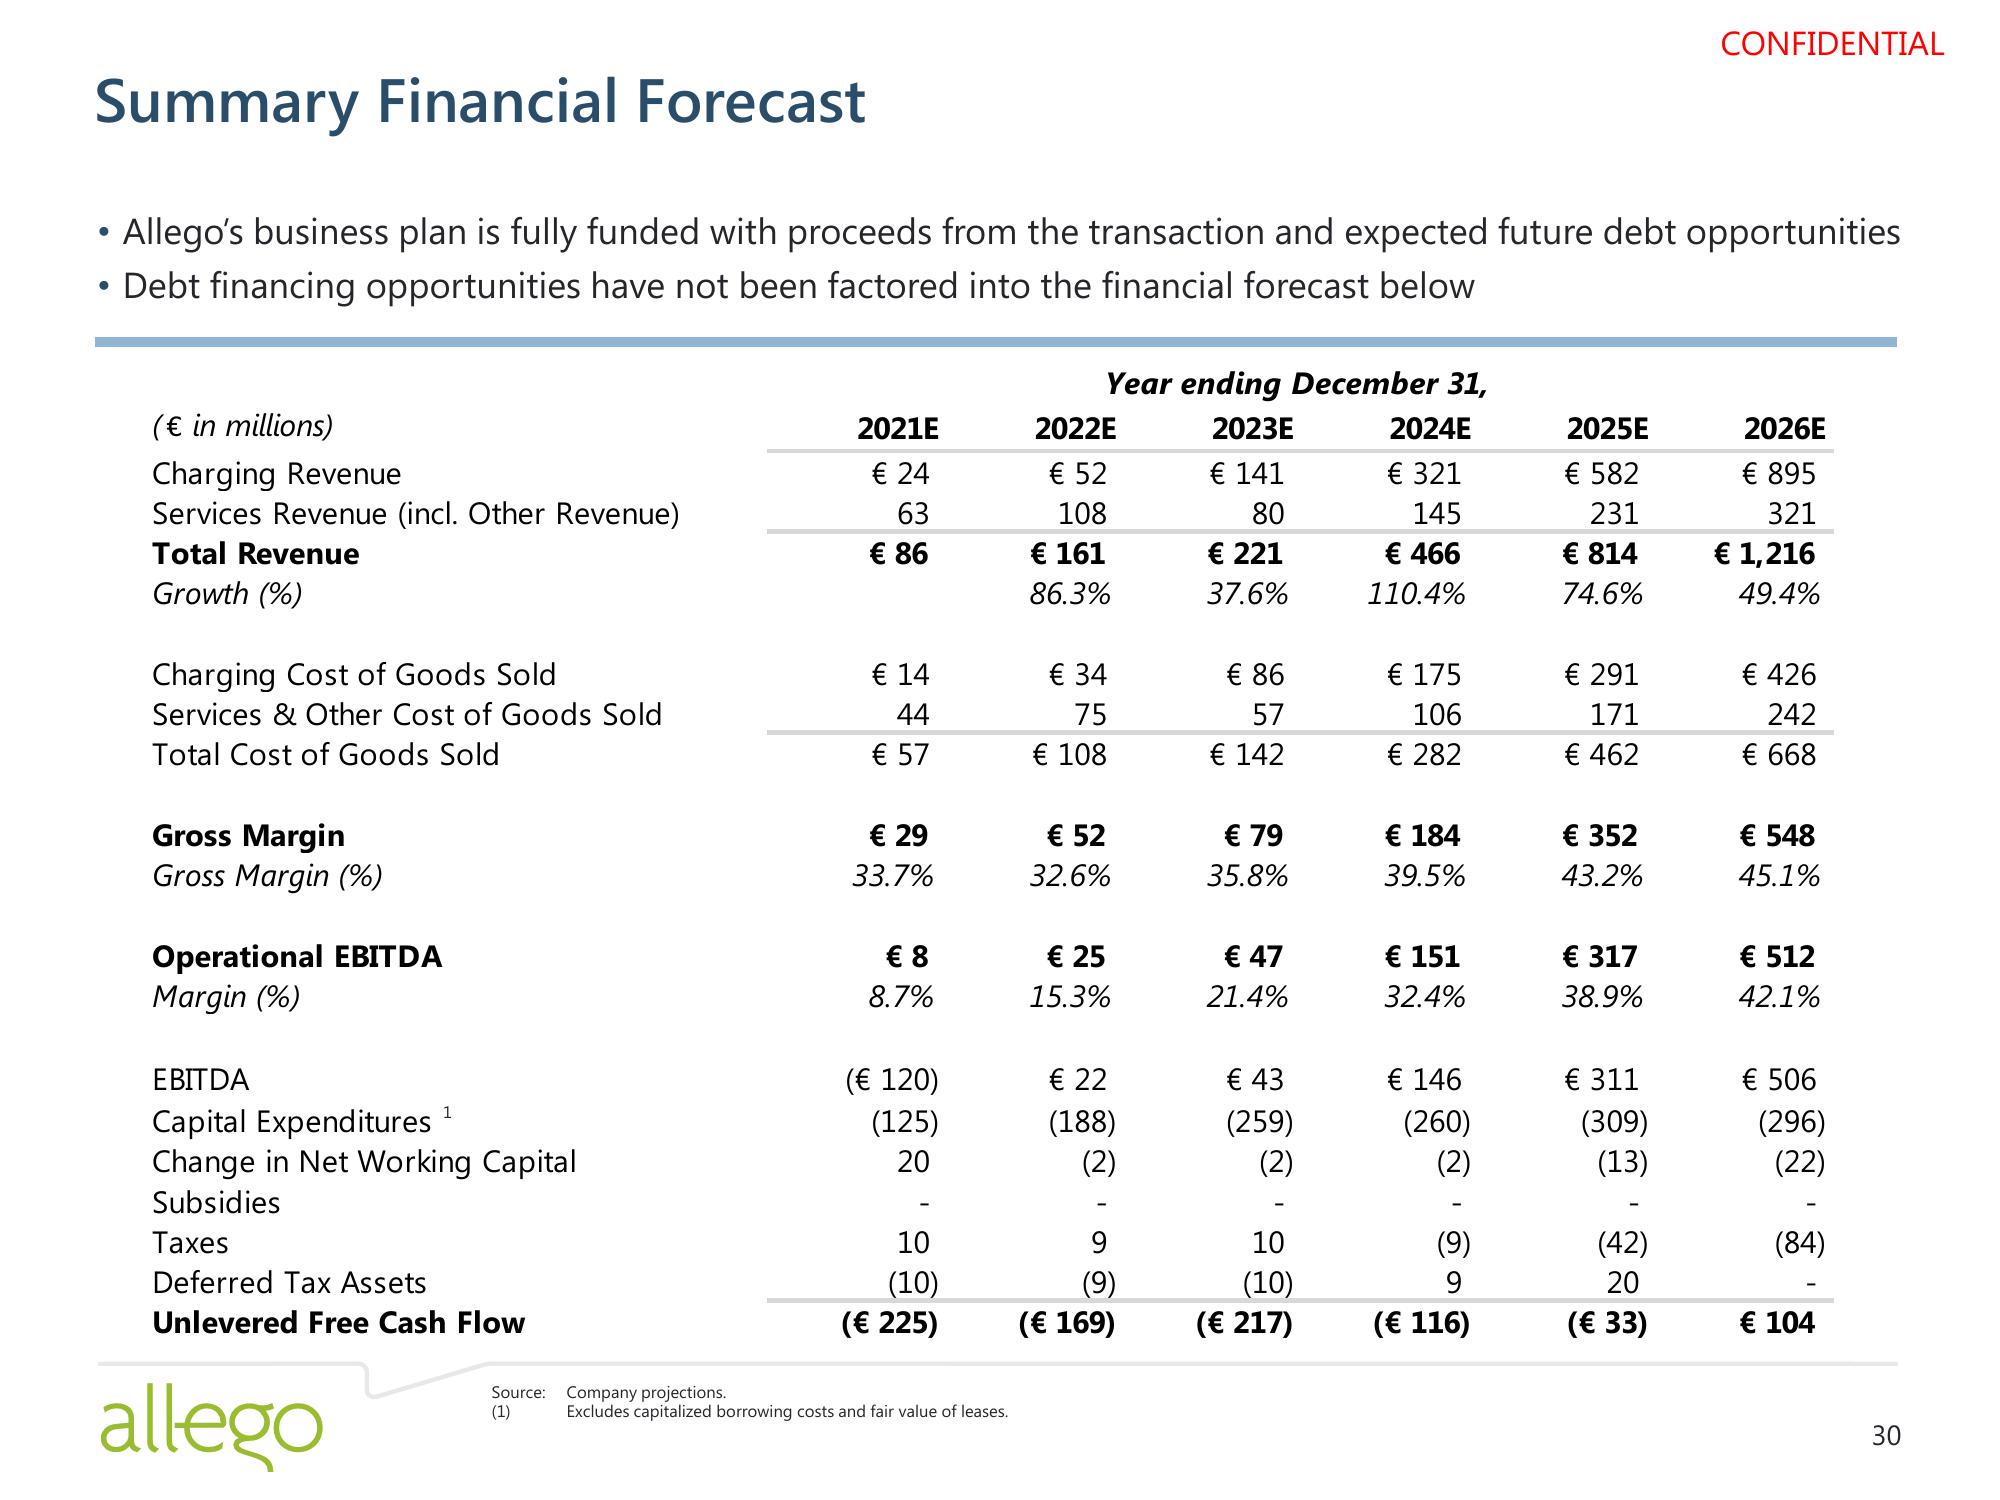
Summary Financial Forecast
• Allego's business plan is fully funded with proceeds from the transaction and expected future debt opportunities
Debt financing opportunities have not been factored into the financial forecast below
●
(€ in millions)
Charging Revenue
Services Revenue (incl. Other Revenue)
Total Revenue
Growth (%)
Charging Cost of Goods Sold
Services & Other Cost of Goods Sold
Total Cost of Goods Sold
Gross Margin
Gross Margin (%)
Operational EBITDA
Margin (%)
EBITDA
Capital Expenditures
Change in Net Working Capital
Subsidies
Taxes
Deferred Tax Assets
Unlevered Free Cash Flow
allego
1
Source:
(1)
2021E
€ 24
63
€ 86
€ 14
44
€ 57
€ 29
33.7%
€ 8
8.7%
(€ 120)
(125)
20
10
(10)
(€ 225)
Company projections.
Excludes capitalized borrowing costs and fair value of leases.
Year ending December 31,
2023E
€ 141
80
€ 221
37.6%
2022E
€ 52
108
€ 161
86.3%
€ 34
75
€ 108
€ 52
32.6%
€ 25
15.3%
€ 22
(188)
(2)
9
(9)
(€ 169)
€ 86
57
€ 142
€ 79
35.8%
€ 47
21.4%
€ 43
(259)
(2)
10
(10)
(€ 217)
2024E
€ 321
145
€ 466
110.4%
€ 175
106
€ 282
€ 184
39.5%
€ 151
32.4%
€ 146
(260)
(2)
(9)
9
(€ 116)
2025E
€ 582
231
€ 814
74.6%
€ 291
171
€ 462
€ 352
43.2%
€ 317
38.9%
€ 311
(309)
(13)
CONFIDENTIAL
(42)
20
(€ 33)
2026E
€ 895
321
€ 1,216
49.4%
€ 426
242
€ 668
€ 548
45.1%
€ 512
42.1%
€ 506
(296)
(22)
(84)
€ 104
30View entire presentation