Servicing Portfolio Growth Deck
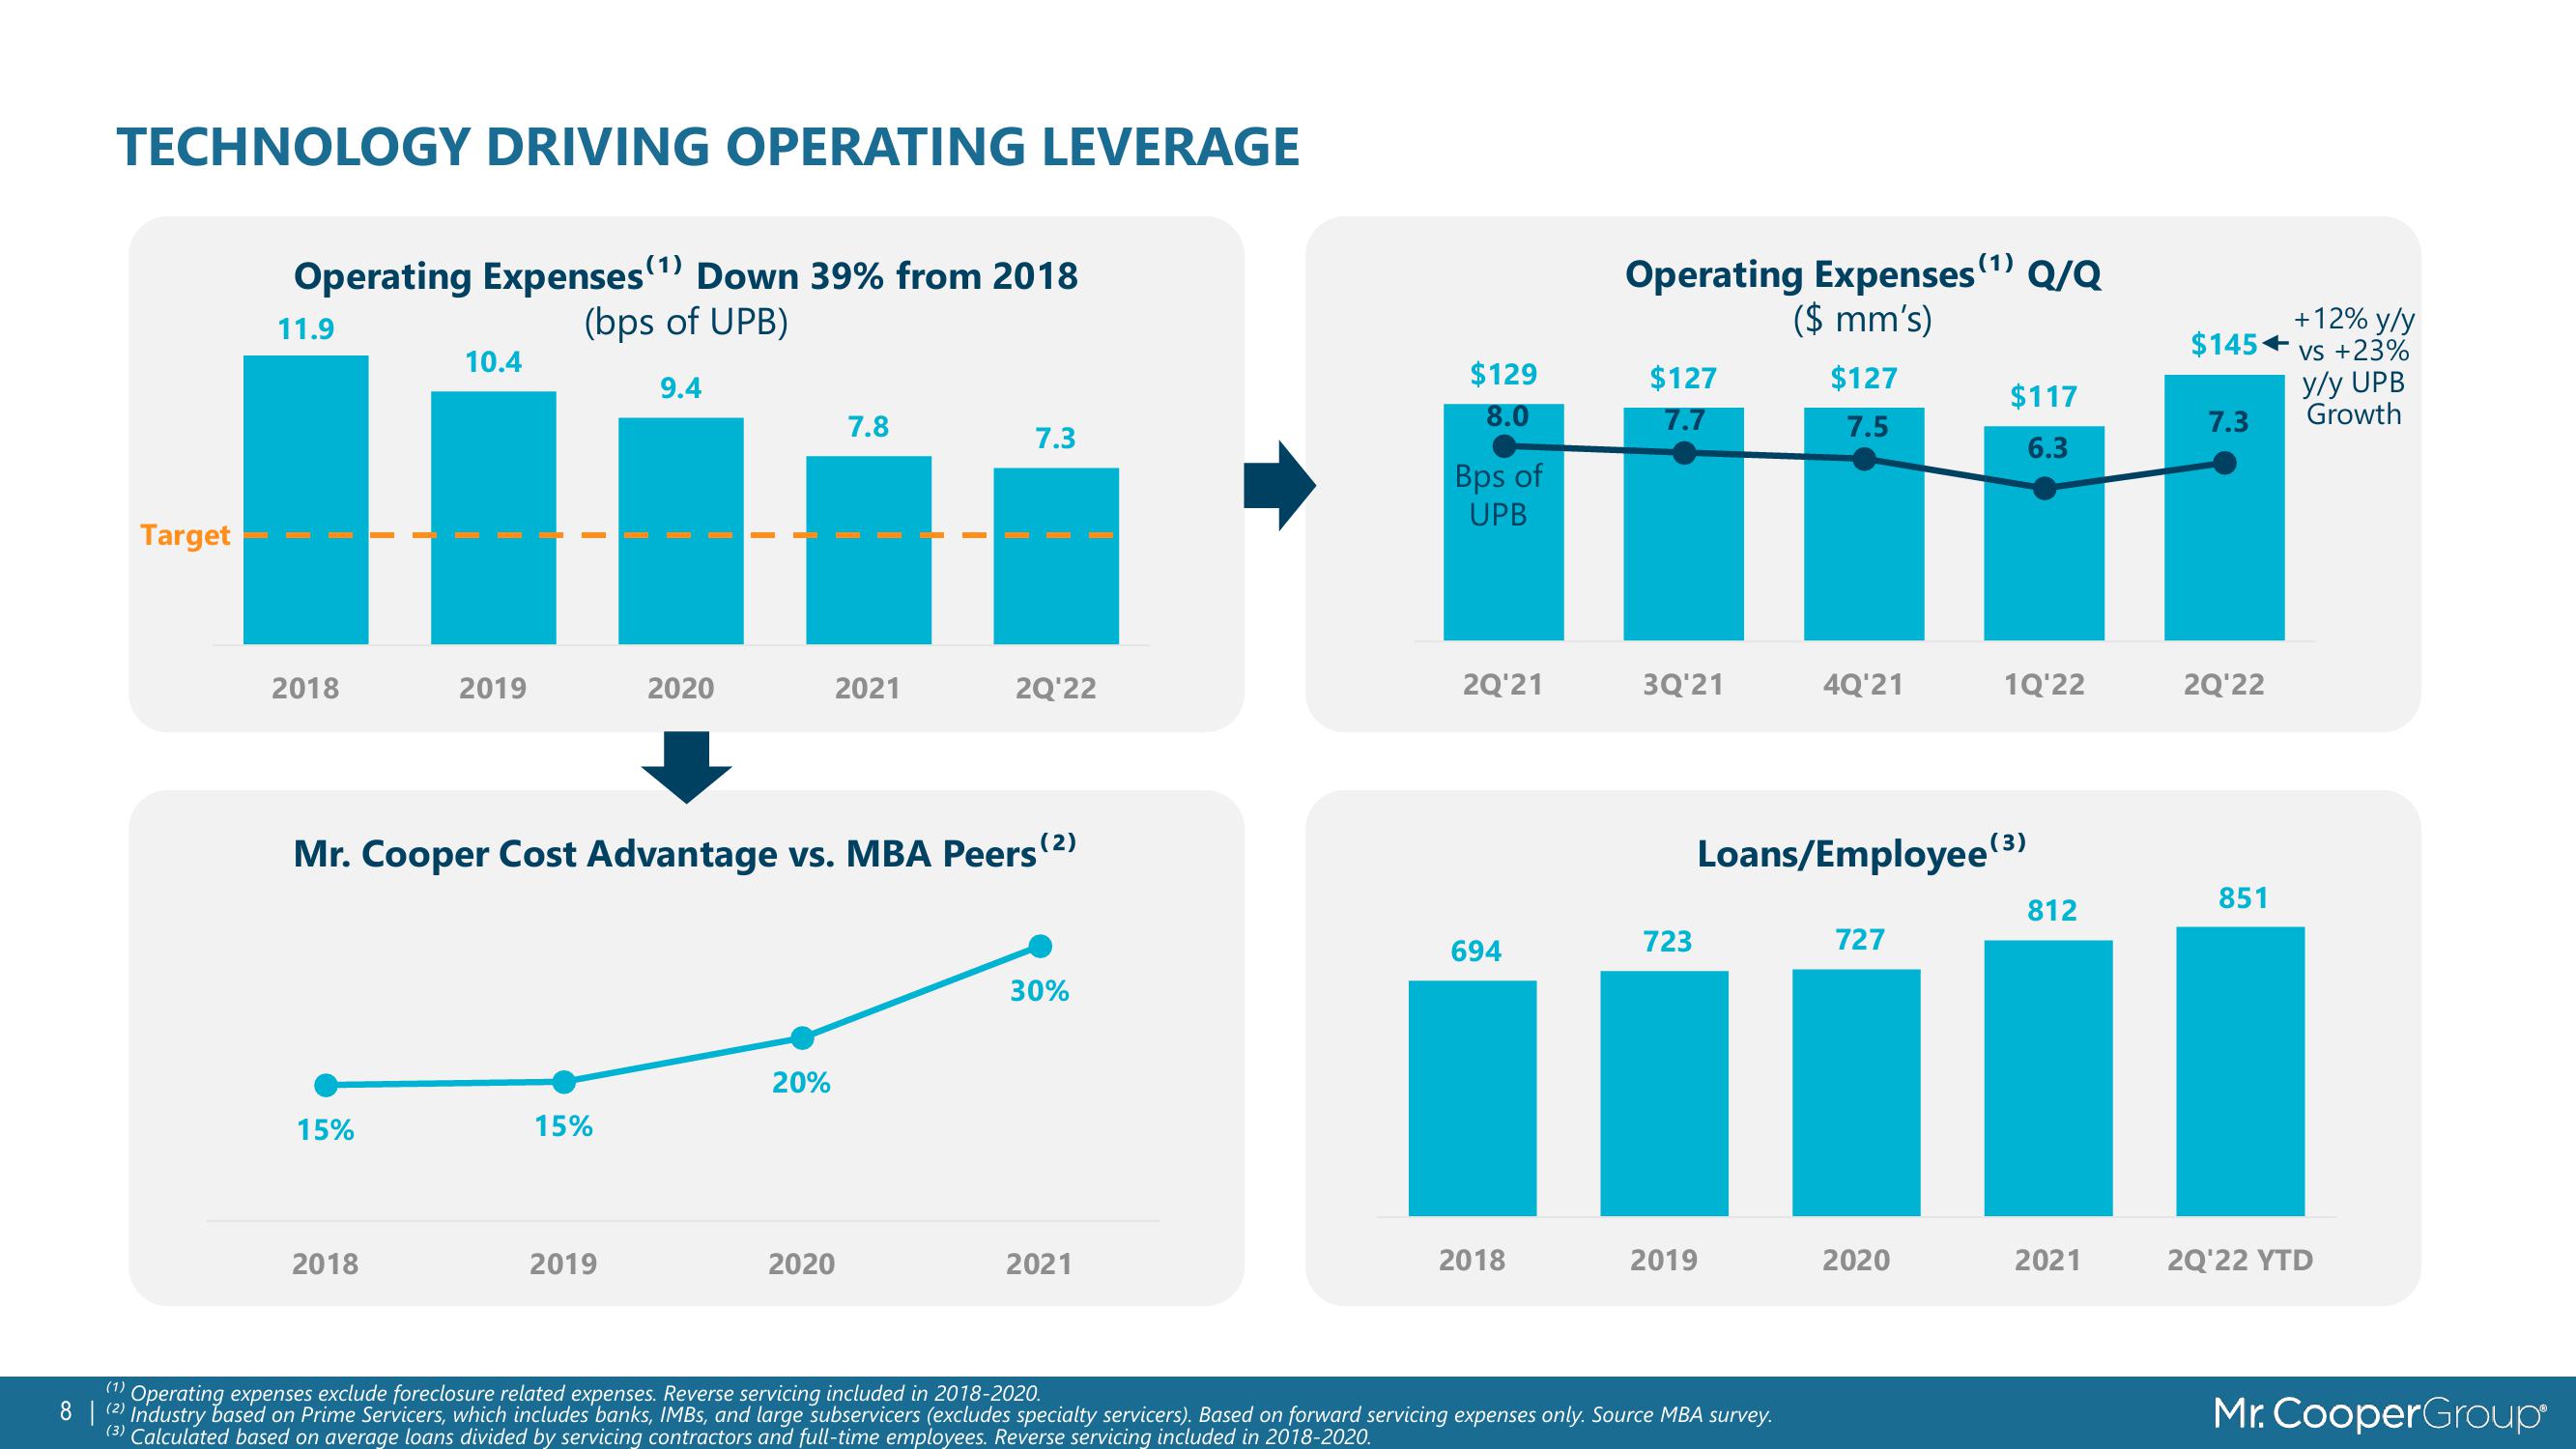
TECHNOLOGY DRIVING OPERATING LEVERAGE
Target
Operating Expenses (¹) Down 39% from 2018
(bps of UPB)
9.4
11.9
2018
15%
10.4
2018
2019
15%
2020
2019
Mr. Cooper Cost Advantage vs. MBA Peers (2)
20%
7.8
2021
2020
7.3
2Q'22
30%
2021
$129
8.0
Bps of
UPB
2Q¹21
694
2018
Operating Expenses (¹) Q/Q
($ mm's)
$127
7.7
3Q'21
723
2019
$127
7.5
(1) Operating expenses exclude foreclosure related expenses. Reverse servicing included in 2018-2020.
8 (2) Industry based on Prime Servicers, which includes banks, IMBS, and large subservicers (excludes specialty servicers). Based on forward servicing expenses only. Source MBA survey.
(3) Calculated based on average loans divided by servicing contractors and full-time employees. Reverse servicing included in 2018-2020.
4Q'21
Loans/Employee (3
727
$117
6.3
2020
1Q'22
812
2021
$145+
7.3
2Q'22
851
+12% y/y
vs +23%
y/y UPB
Growth
2Q'22 YTD
Mr. CooperGroupView entire presentation