LSE Mergers and Acquisitions Presentation Deck
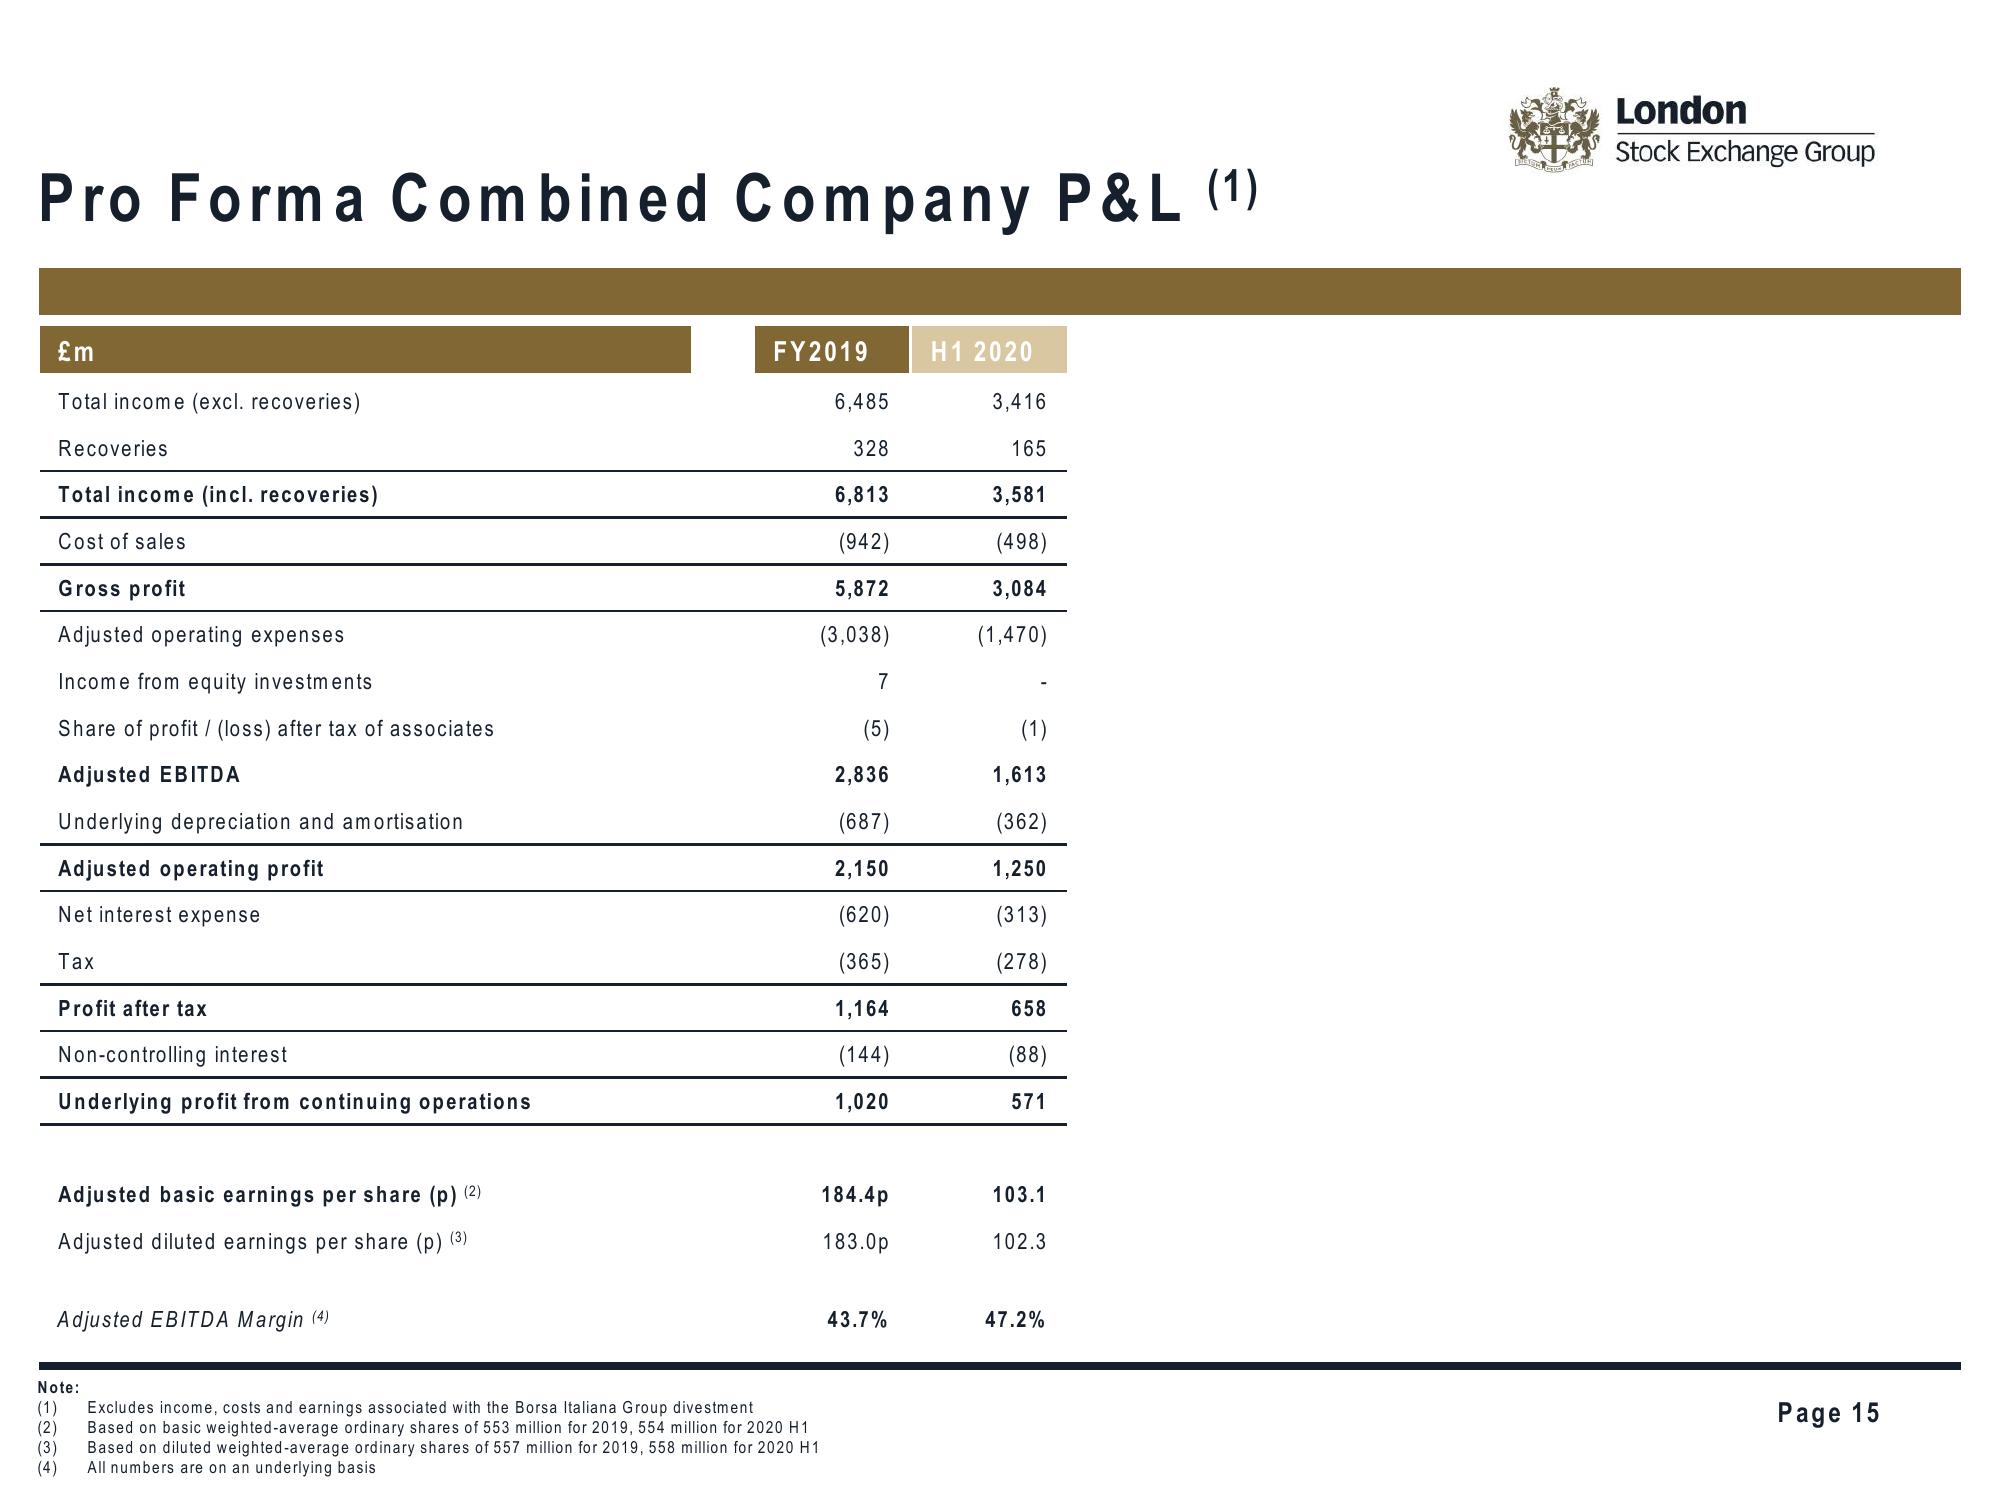
Pro Forma Combined Company P&L (1)
£m
Total income (excl. recoveries)
Recoveries
Total income (incl. recoveries)
Cost of sales
Gross profit
Adjusted operating expenses
Income from equity investments
Share of profit/ (loss) after tax of associates
Adjusted EBITDA
Underlying depreciation and amortisation
Adjusted operating profit
Net interest expense
Tax
Profit after tax
Non-controlling interest
Underlying profit from continuing operations
Adjusted basic earnings per share (p) (2)
Adjusted diluted earnings per share (p) (³)
Adjusted EBITDA Margin (4)
FY2019
6,485
328
6,813
(942)
5,872
(3,038)
Note:
(1)
Excludes income, costs and earnings associated with the Borsa Italiana Group divestment
(2) Based on basic weighted-average ordinary shares of 553 million for 2019, 554 million for 2020 H1
(3) Based on diluted weighted-average ordinary shares of 557 million for 2019, 558 million for 2020 H1
(4) All numbers are on an underlying basis
7
(5)
2,836
(687)
2,150
(620)
(365)
1,164
(144)
1,020
184.4p
183.0p
43.7%
H1 2020
3,416
165
3,581
(498)
3,084
(1,470)
(1)
1,613
(362)
1,250
(313)
(278)
658
(88)
571
103.1
102.3
47.2%
London
Stock Exchange Group
Page 15View entire presentation