Cboe Results Presentation Deck
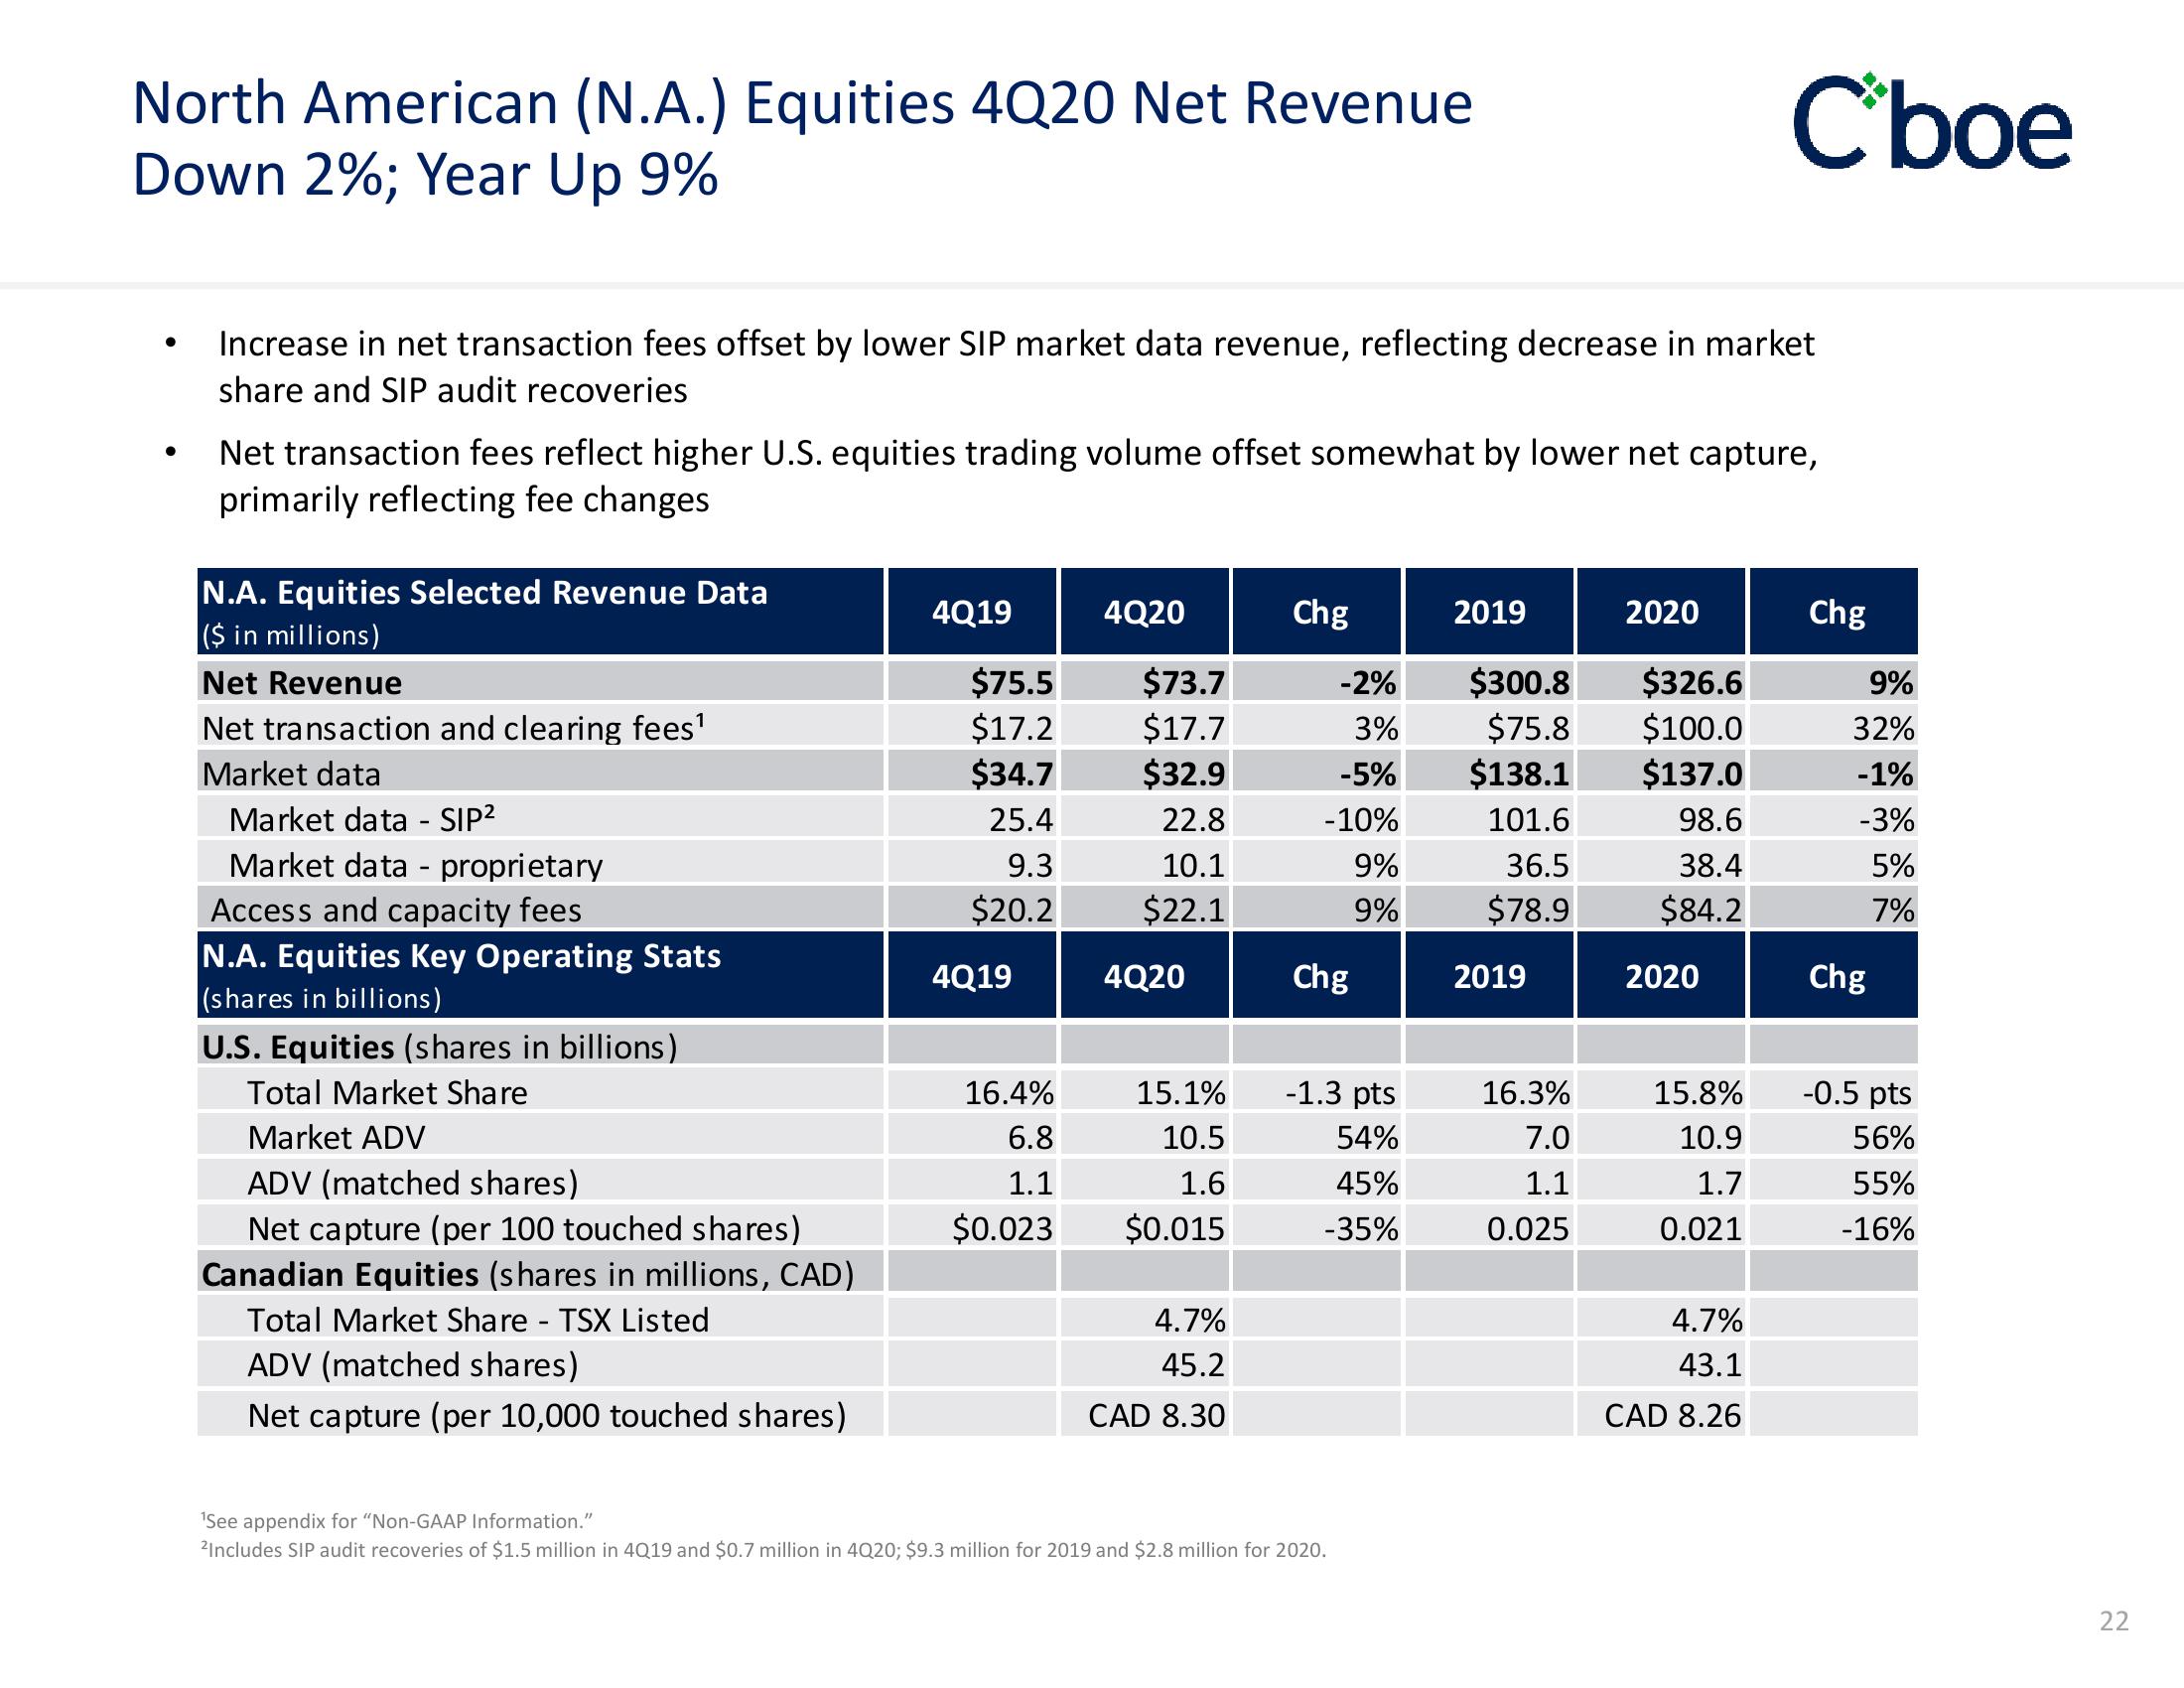
North American (N.A.) Equities 4Q20 Net Revenue
Down 2%; Year Up 9%
●
●
Increase in net transaction fees offset by lower SIP market data revenue, reflecting decrease in market
share and SIP audit recoveries
Net transaction fees reflect higher U.S. equities trading volume offset somewhat by lower net capture,
primarily reflecting fee changes
N.A. Equities Selected Revenue Data
($ in millions)
Net Revenue
Net transaction and clearing fees¹
Market data
Market data - SIP²
Market data proprietary
Access and capacity fees
N.A. Equities Key Operating Stats
(shares in billions)
U.S. Equities (shares in billions)
Total Market Share
Market ADV
ADV (matched shares)
Net capture (per 100 touched shares)
Canadian Equities (shares in millions, CAD)
Total Market Share - TSX Listed
ADV (matched shares)
Net capture (per 10,000 touched shares)
-
4Q19
$75.5
$17.2
$34.7
25.4
9.3
$20.2
4Q19
16.4%
6.8
1.1
$0.023
4Q20
$73.7
$17.7
$32.9
22.8
10.1
$22.1
4Q20
15.1%
10.5
1.6
$0.015
4.7%
45.2
CAD 8.30
Chg
-2%
3%
-5%
-10%
9%
9%
Chg
-1.3 pts
54%
45%
-35%
¹See appendix for "Non-GAAP Information."
2Includes SIP audit recoveries of $1.5 million in 4Q19 and $0.7 million in 4Q20; $9.3 million for 2019 and $2.8 million for 2020.
2019
$300.8
$75.8
$138.1
101.6
36.5
$78.9
2019
16.3%
7.0
1.1
0.025
2020
$326.6
$100.0
$137.0
98.6
38.4
$84.2
2020
C'boe
15.8%
10.9
1.7
0.021
4.7%
43.1
CAD 8.26
Chg
9%
32%
-1%
-3%
5%
7%
Chg
-0.5 pts
56%
55%
-16%
22View entire presentation