LVMH Results Presentation Deck
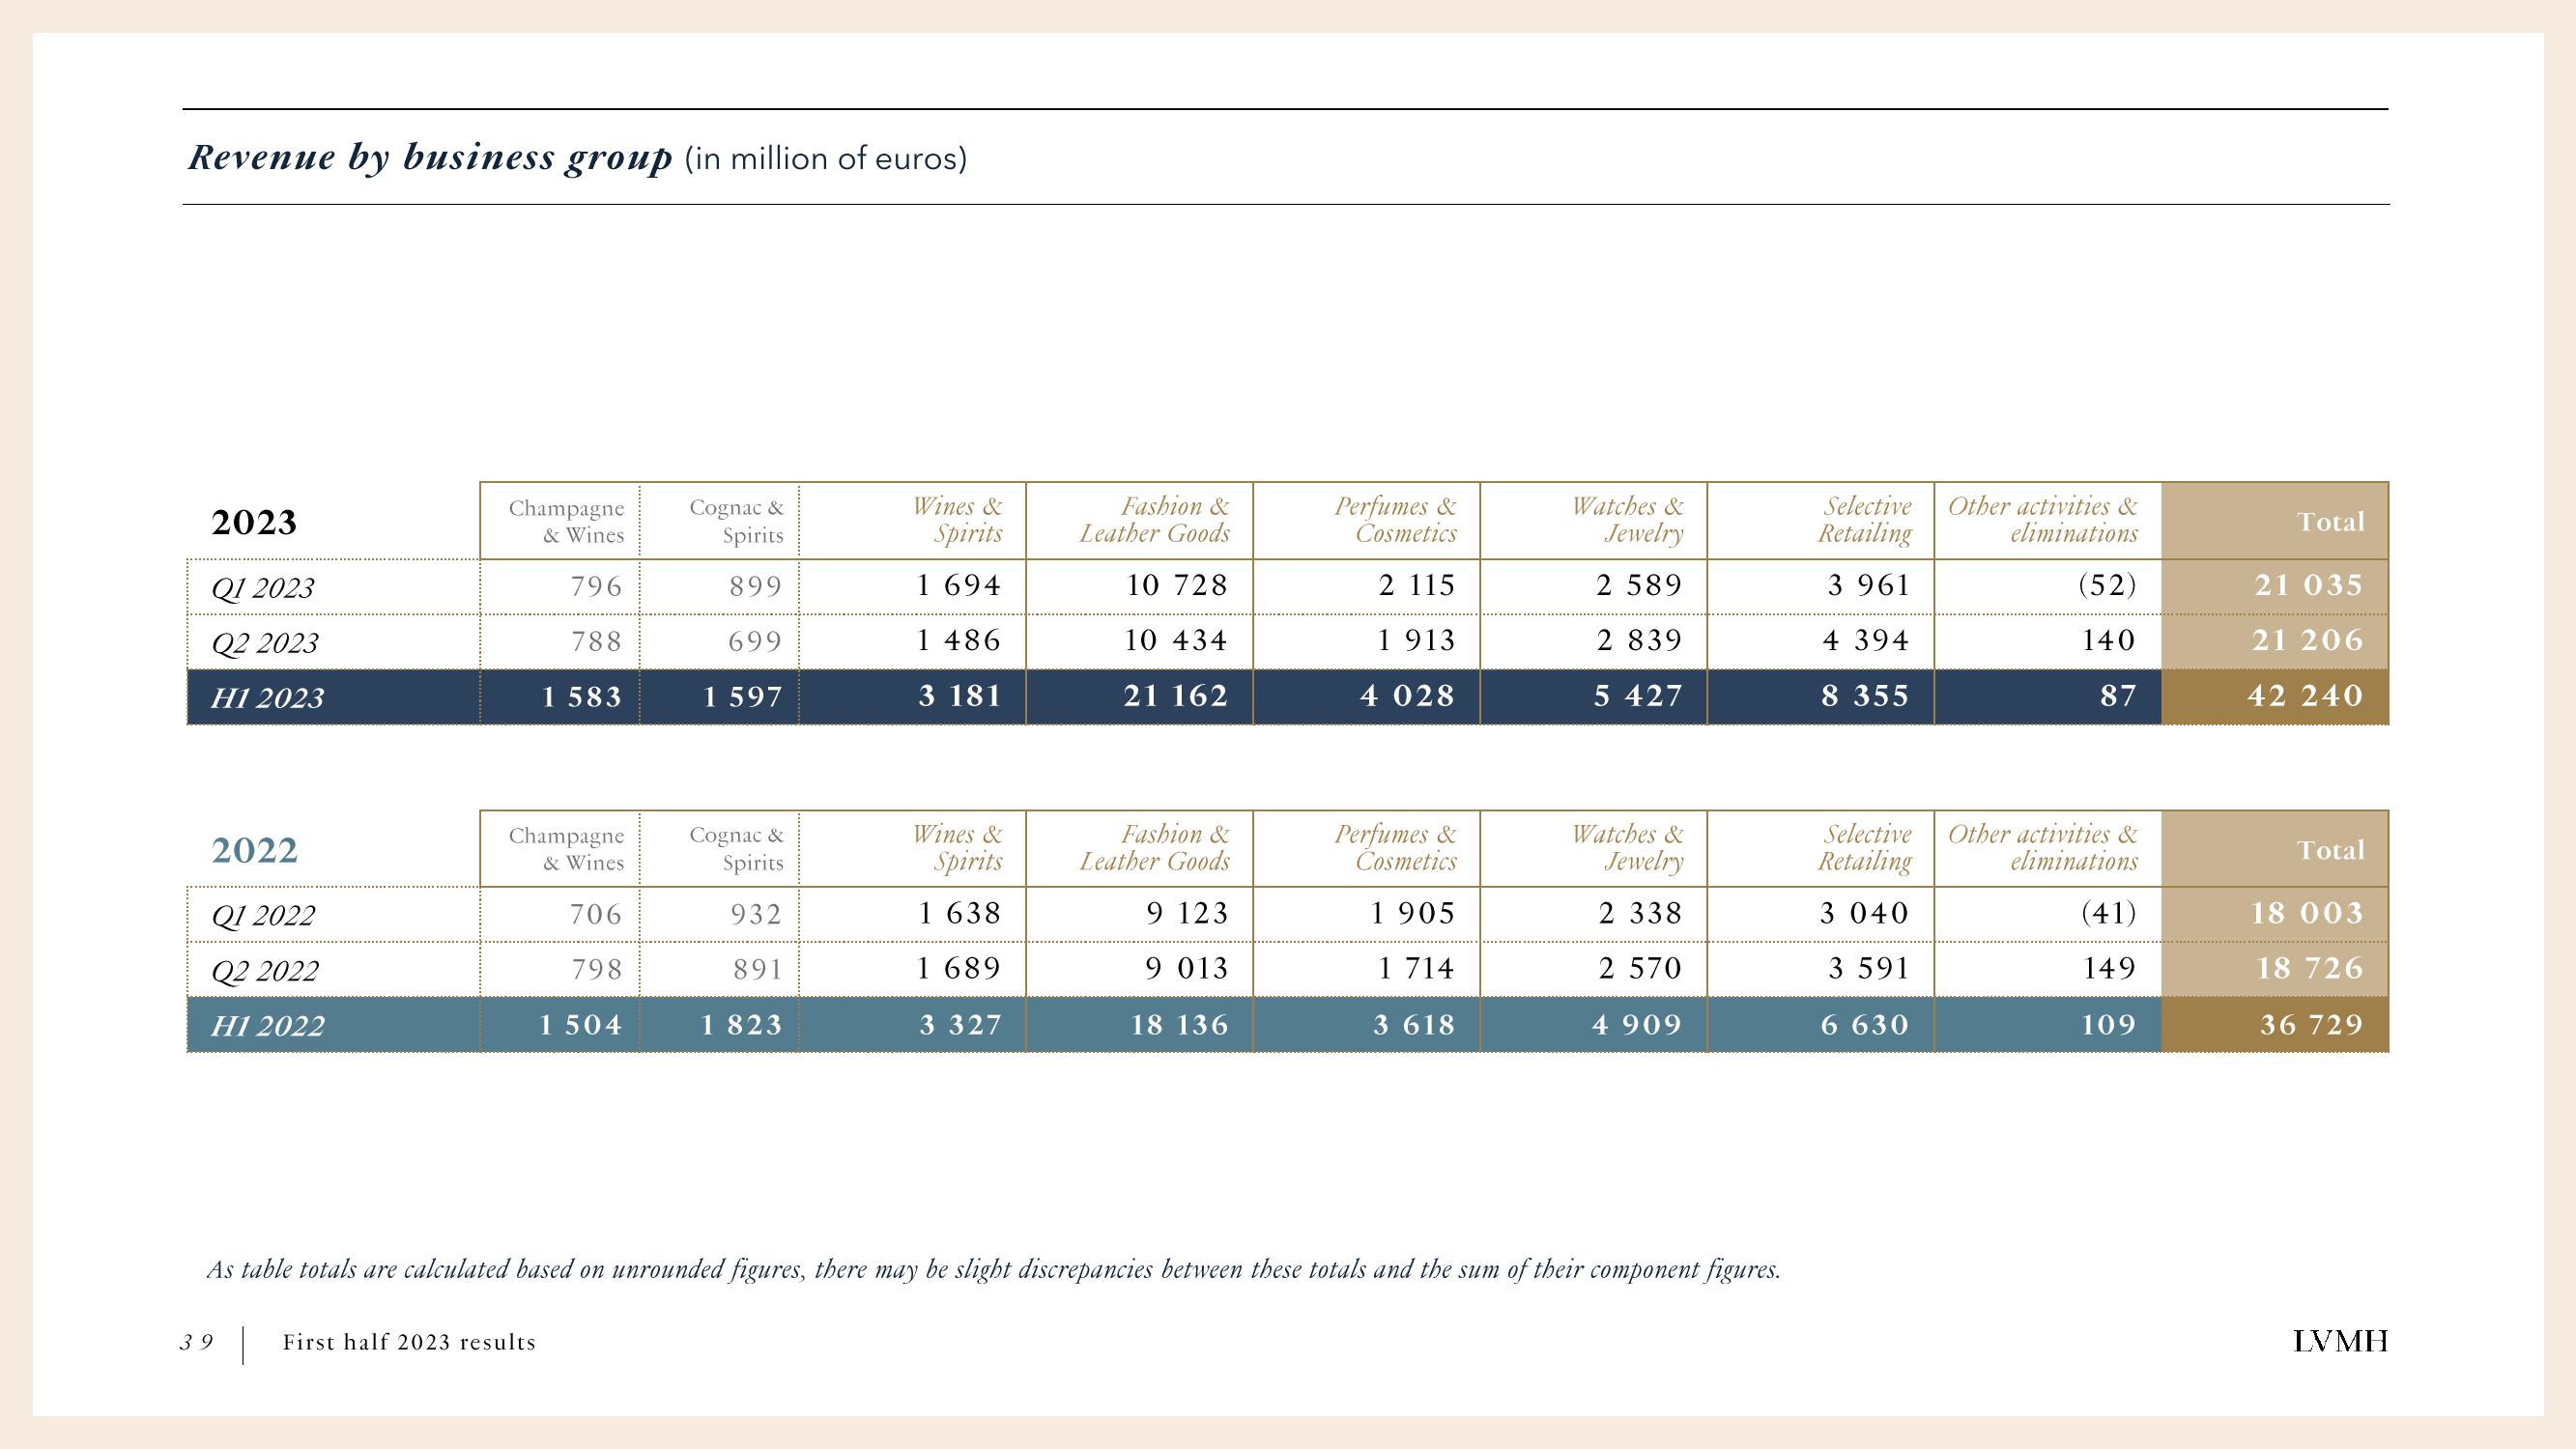
Revenue by business group (in million of euros)
2023
Q1 2023
Q2 2023
H1 2023
2022
Q1 2022
Q2 2022
H1 2022
Champagne
& Wines
796
788
1 583
Champagne
& Wines
39 First half 2023 results
706
798
1 504
Cognac &
Spirits
899
699
1 597
Cognac &
Spirits
932
891
1 823
Wines &
Spirits
1 694
1 486
3 181
Wines &
Spirits
1 638
1 689
3 327
Fashion &
Leather Goods
10 728
10 434
21 162
Fashion &
Leather Goods
9 123
9 013
18 136
Perfumes &
Cosmetics
2 115
1 913
4 028
Perfumes &
Cosmetics
1 905
1 714
3 618
Watches &
Jewelry
2 589
2 839
5 427
Watches &
Jewelry
2 338
2 570
4 909
As table totals are calculated based on unrounded figures, there may be slight discrepancies between these totals and the sum of their component figures.
Selective
Retailing
3 961
4 394
8 355
Selective
Retailing
3 040
3 591
6 630
Other activities &
eliminations
(52)
140
87
Other activities &
eliminations
(41)
149
109
Total
21 035
21 206
42 240
Total
18 003
18 726
36 729
LVMHView entire presentation