Crocs Investor Presentation Deck
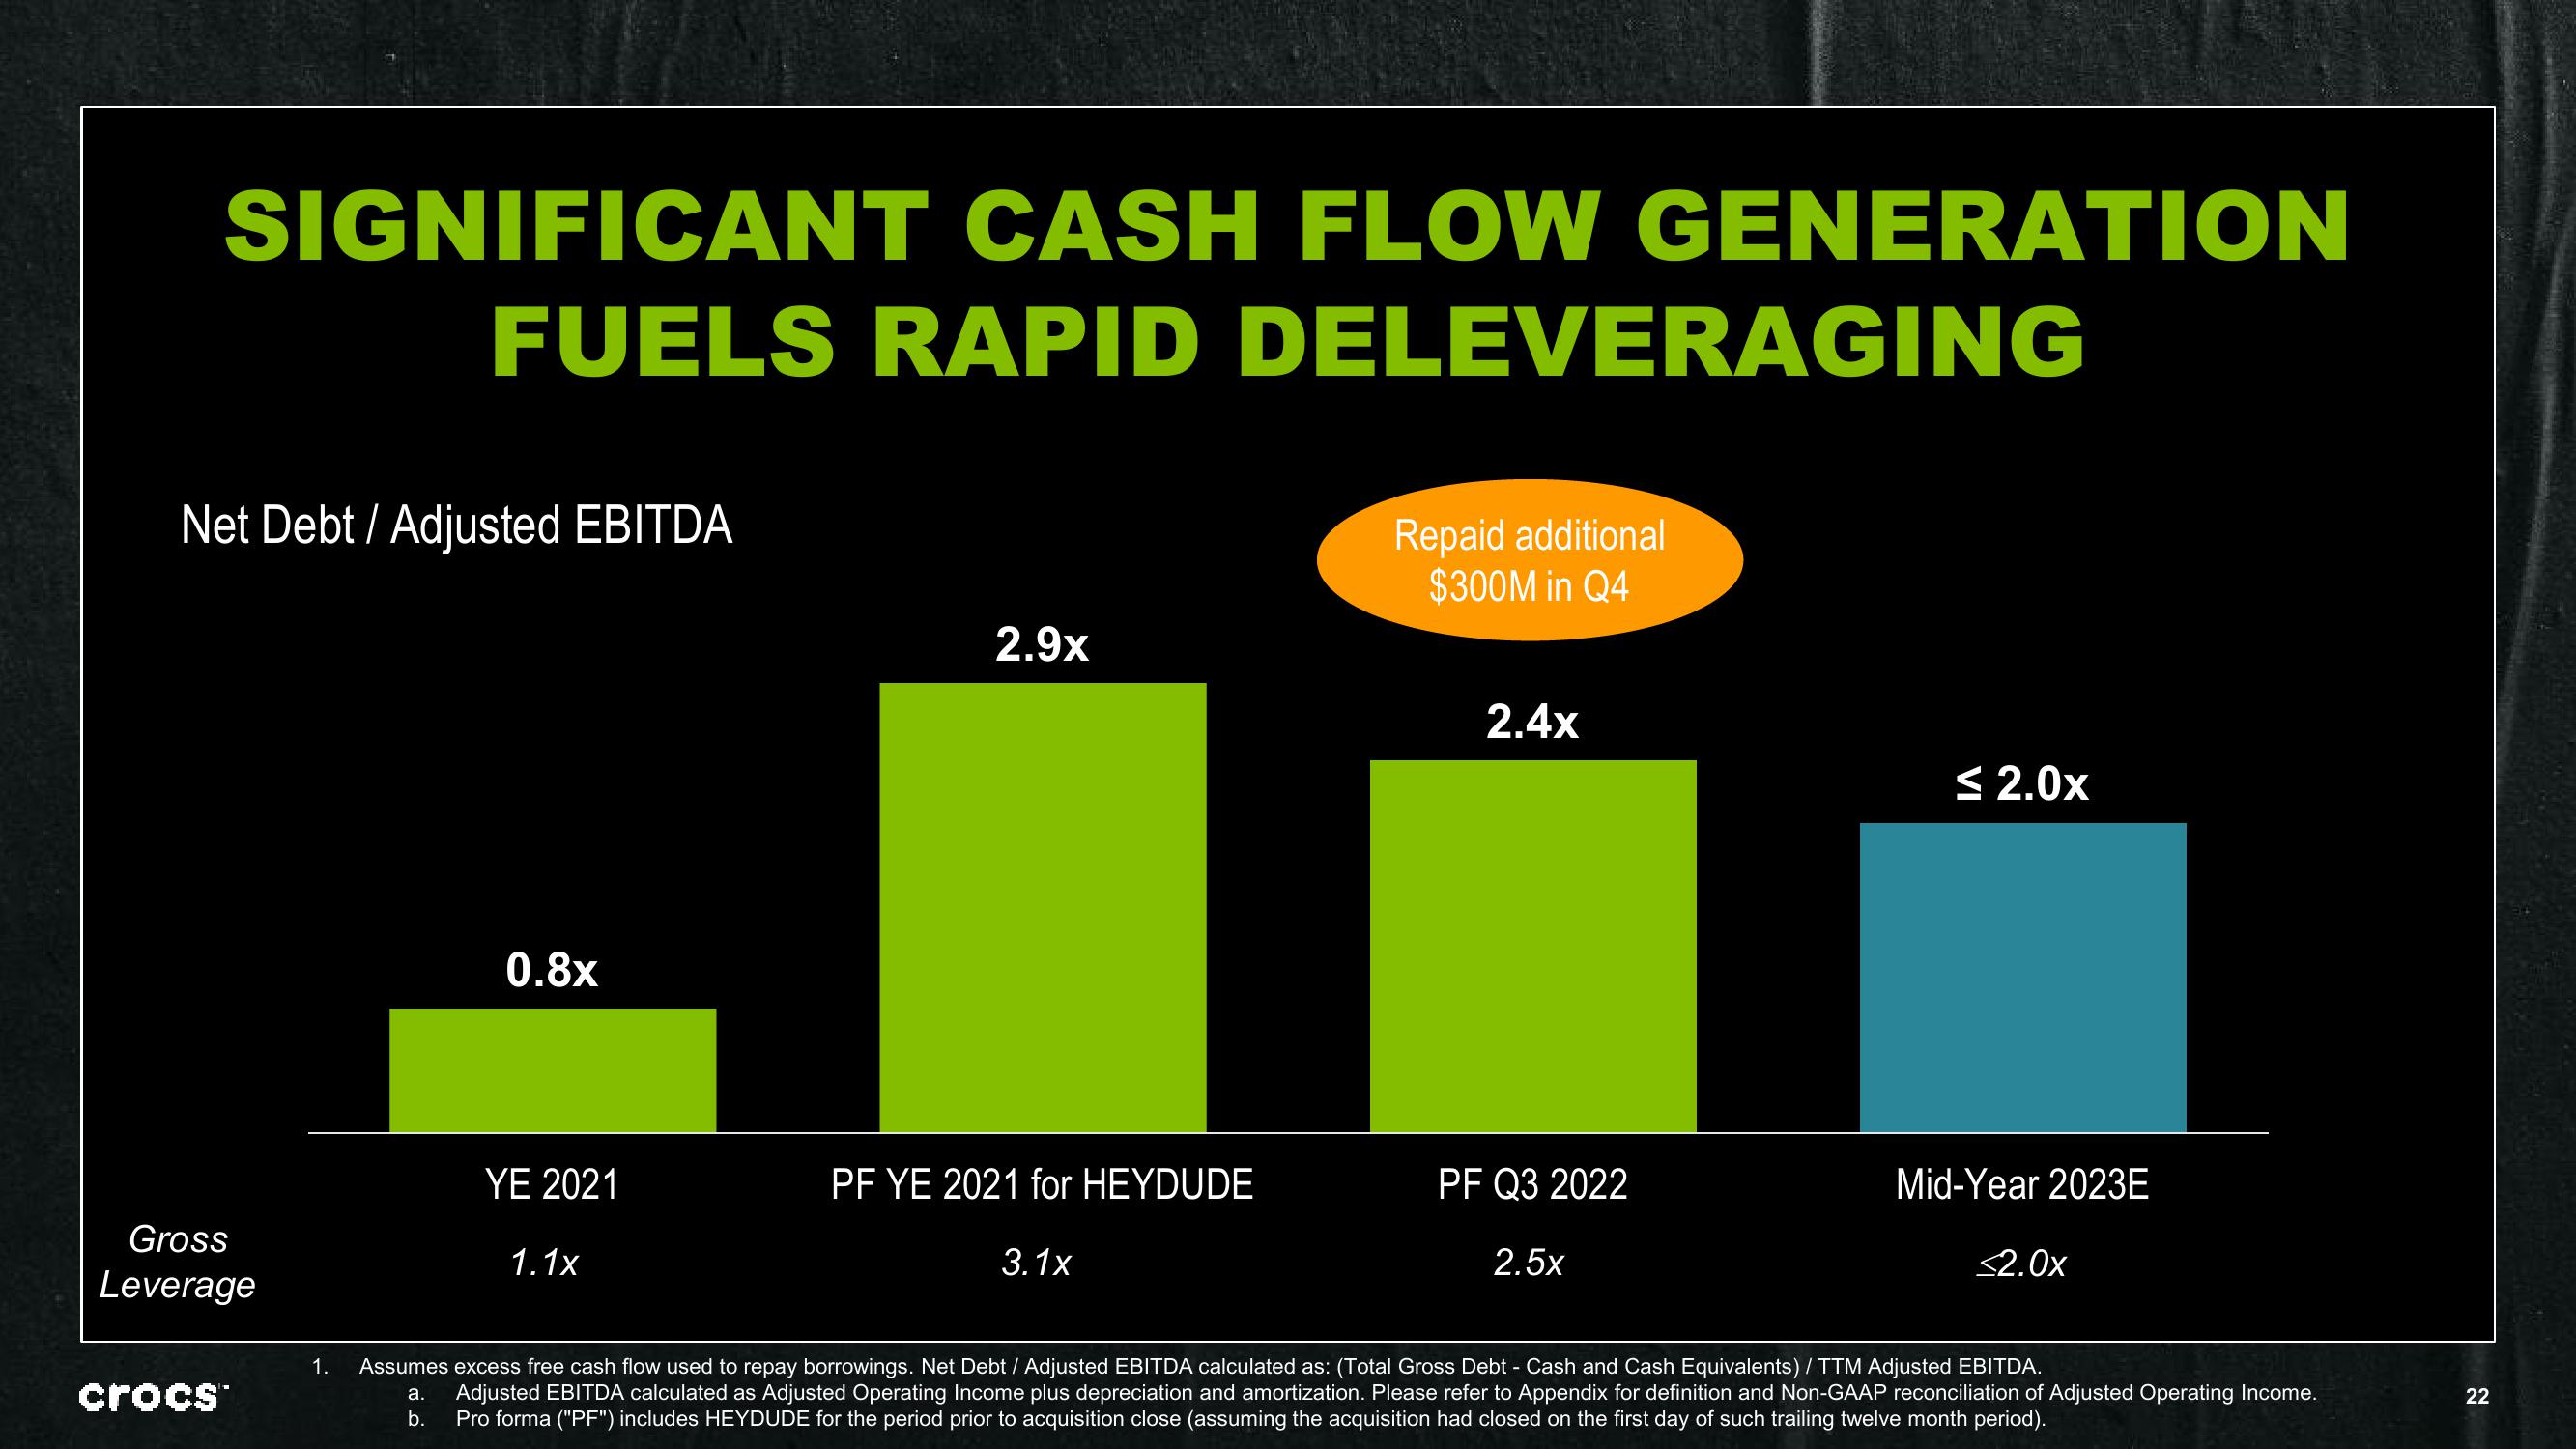
SIGNIFICANT CASH FLOW GENERATION
FUELS RAPID
Net Debt / Adjusted EBITDA
Gross
Leverage
crocs™
0.8x
YE 2021
1.1x
2.9x
DELEVERAGING
PF YE 2021 for HEYDUDE
3.1x
Repaid additional
$300M in Q4
2.4x
PF Q3 2022
2.5x
≤2.0x
Mid-Year 2023E
<2.0x
1. Assumes excess free cash flow used to repay borrowings. Net Debt / Adjusted EBITDA calculated as: (Total Gross Debt - Cash and Cash Equivalents) / TTM Adjusted EBITDA.
a. Adjusted EBITDA calculated as Adjusted Operating Income plus depreciation and amortization. Please refer to Appendix for definition and Non-GAAP reconciliation of Adjusted Operating Income.
b.
Pro forma ("PF") includes HEYDUDE for the period prior to acquisition close (assuming the acquisition had closed on the first day of such trailing twelve month period).
22View entire presentation