zSpace SPAC
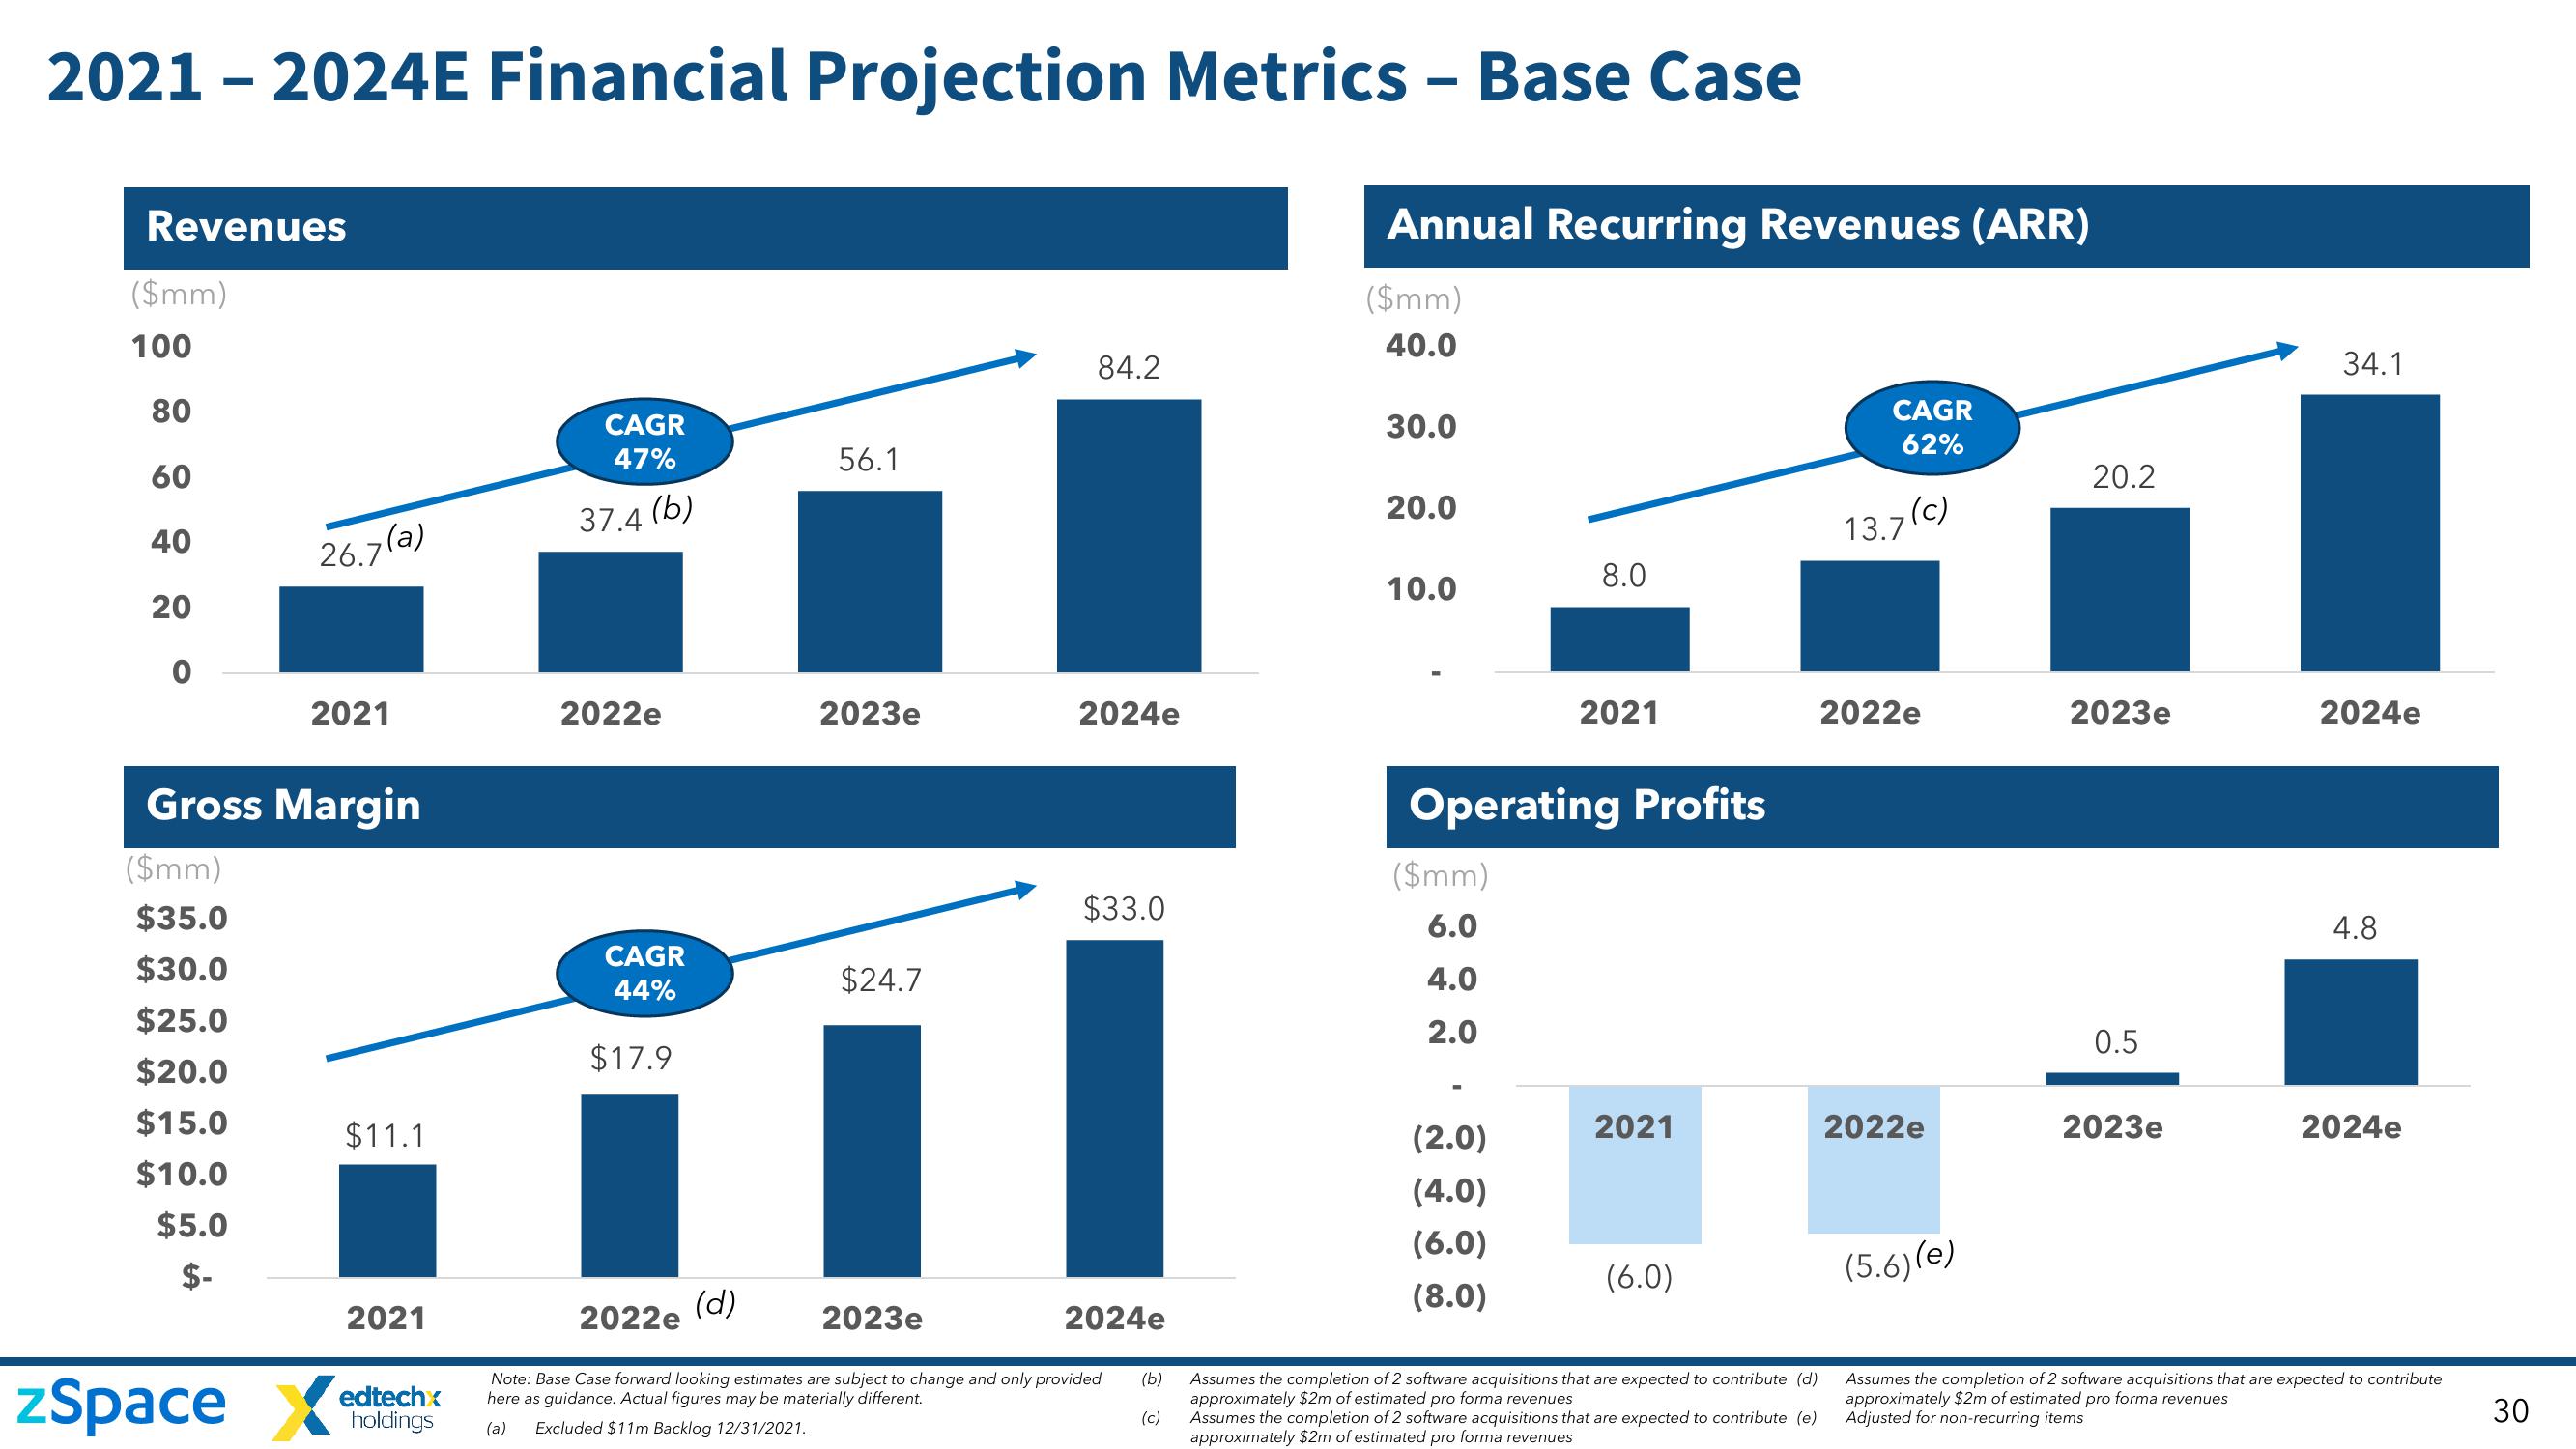
2021 - 2024E Financial Projection Metrics - Base Case
Revenues
($mm)
100
80
60
40
20
0
26.7(a)
2021
Gross Margin
($mm)
$35.0
$30.0
$25.0
$20.0
$15.0
$10.0
$5.0
$-
zSpace X
$11.1
2021
edtechx
holdings
CAGR
47%
37.4 (b)
2022e
CAGR
44%
$17.9
(d)
56.1
2023e
$24.7
84.2
2024e
$33.0
2022e
2023e
Note: Base Case forward looking estimates are subject to change and only provided
here as guidance. Actual figures may be materially different.
(a) Excluded $11m Backlog 12/31/2021.
2024e
(b)
(c)
Annual Recurring Revenues (ARR)
($mm)
40.0
30.0
20.0
10.0
($mm)
6.0
4.0
2.0
8.0
Operating Profits
(2.0)
(4.0)
(6.0)
(8.0)
2021
2021
(6.0)
Assumes the completion of 2 software acquisitions that are expected to contribute (d)
approximately $2m of estimated pro forma revenues
Assumes the completion of 2 software acquisitions that are expected to contribute (e)
approximately $2m of estimated pro forma revenues
CAGR
62%
13.7(c)
2022e
2022e
(5.6) (e)
20.2
2023e
0.5
2023e
34.1
2024e
4.8
2024e
Assumes the completion of 2 software acquisitions that are expected to contribute
approximately $2m of estimated pro forma revenues
Adjusted for non-recurring items
30View entire presentation