Micro Focus Credit Presentation Deck
17
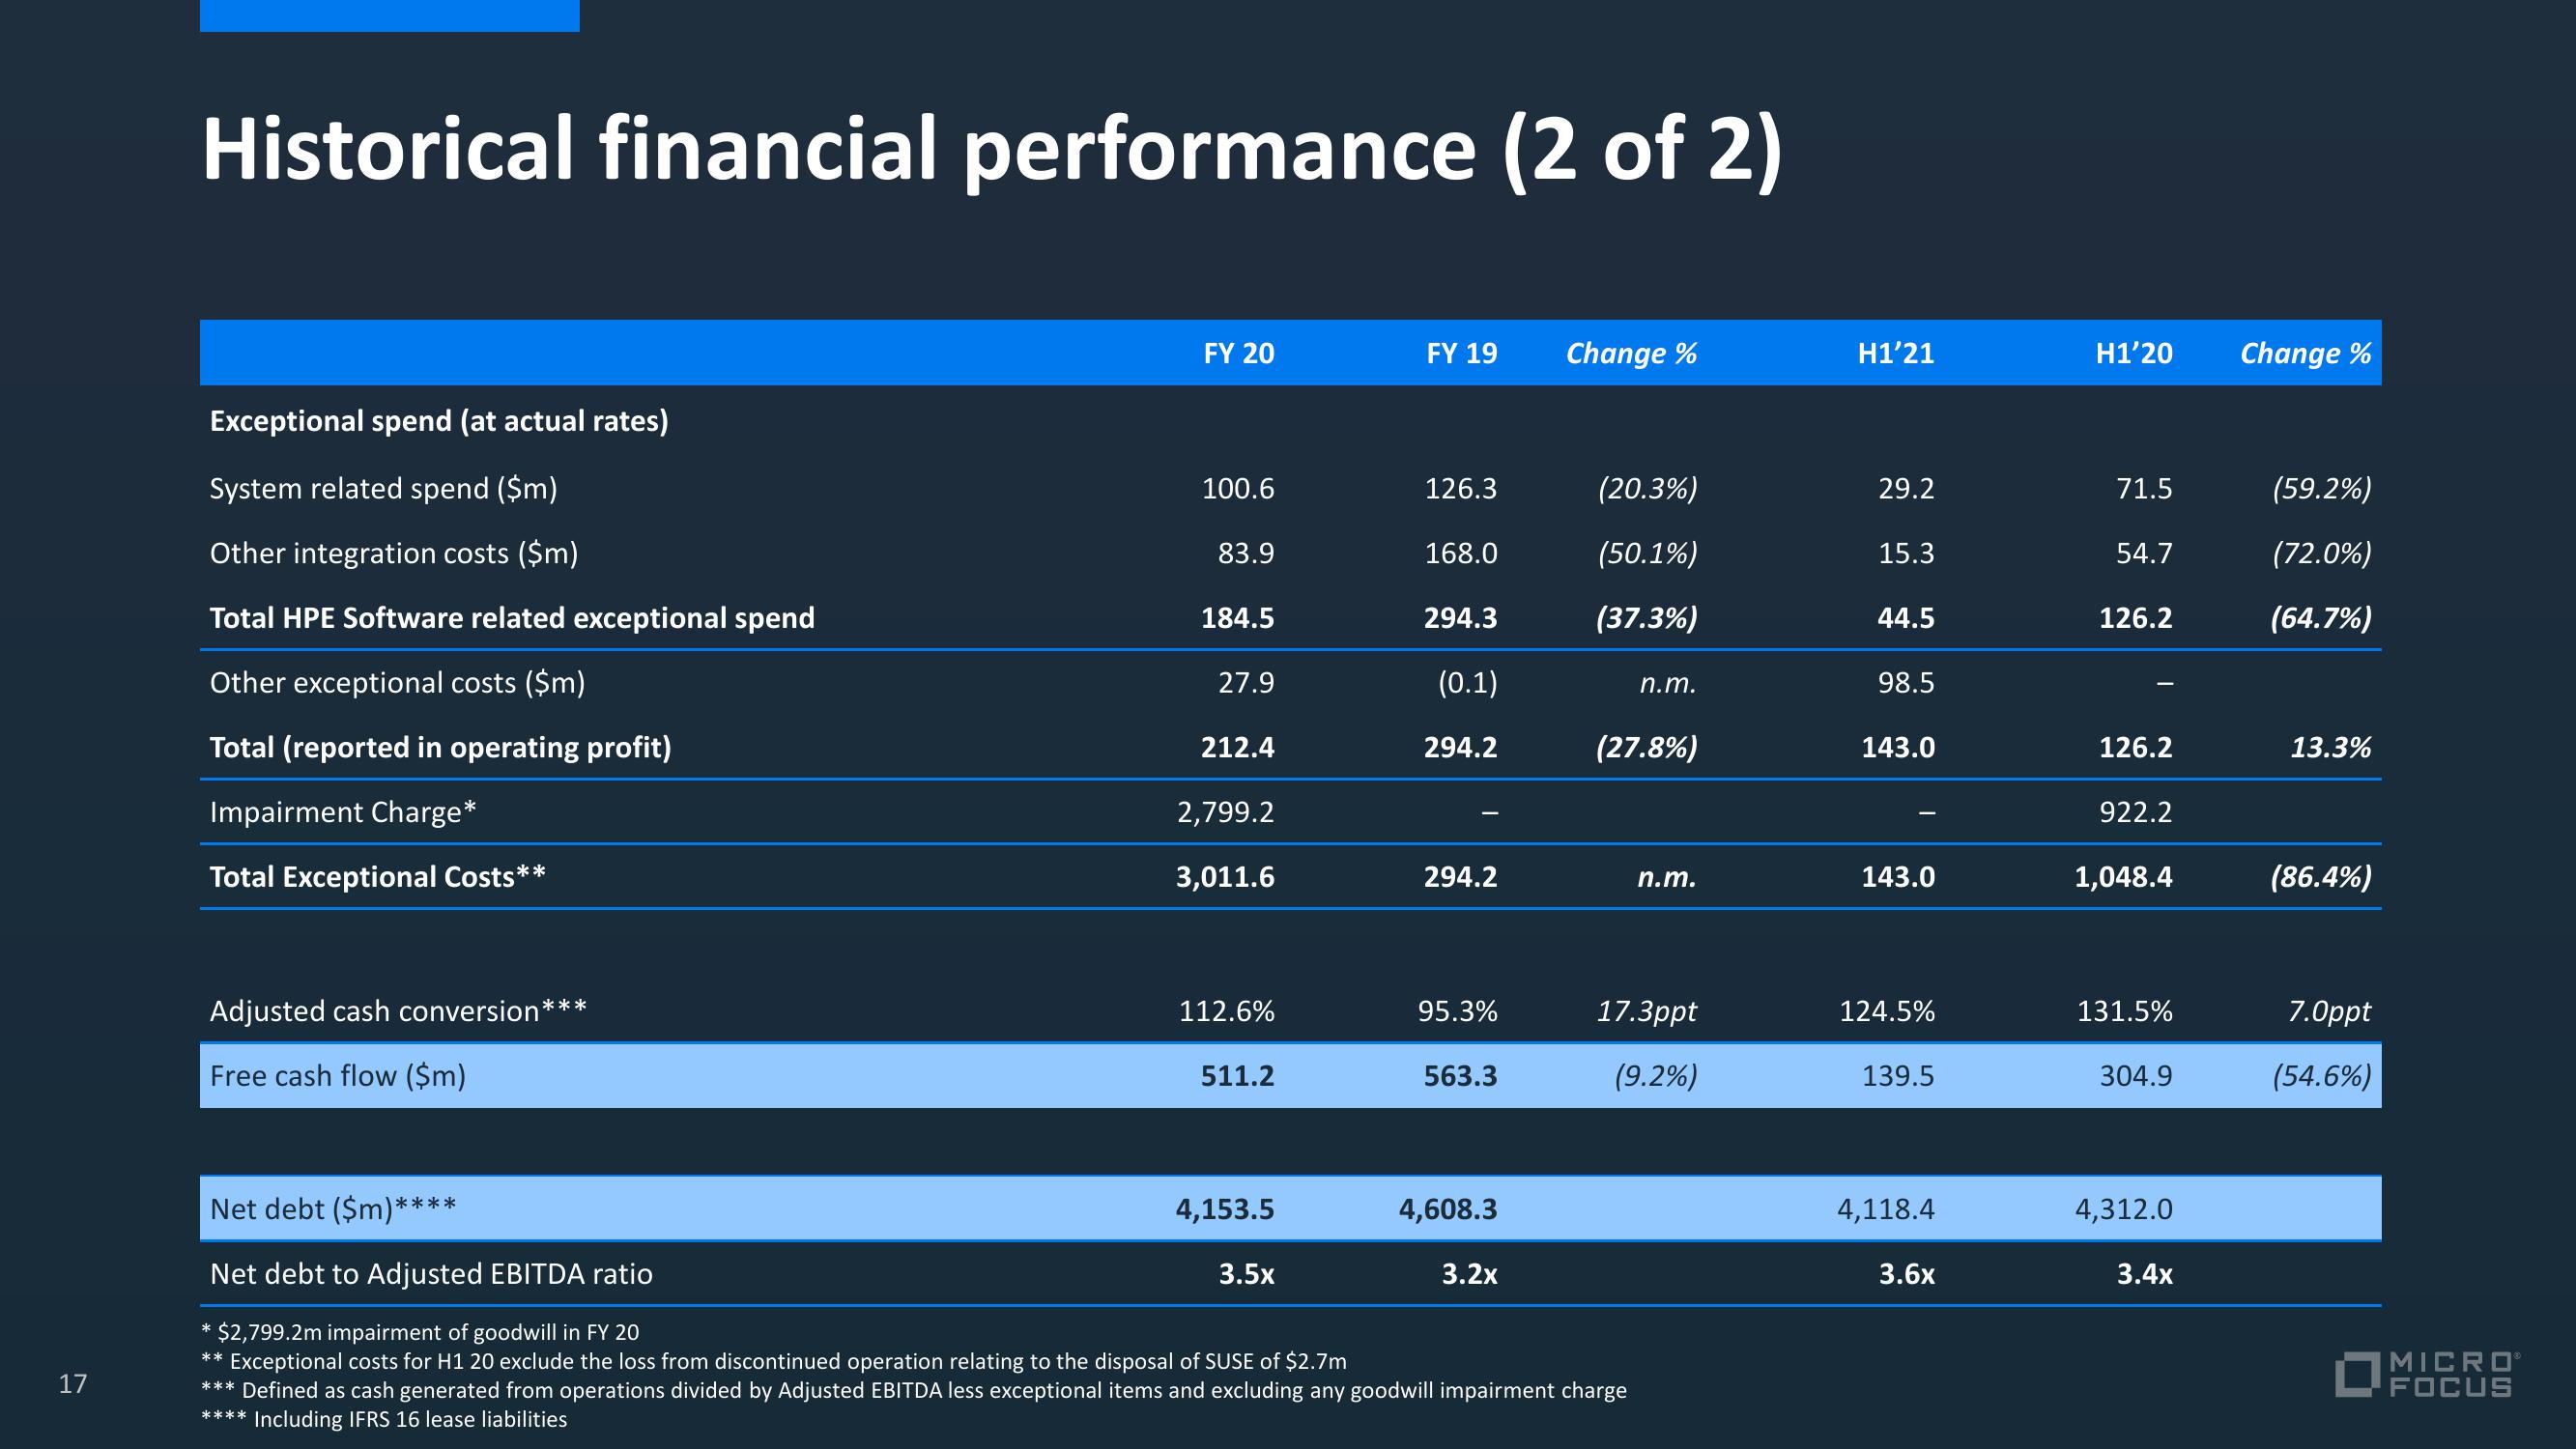
Historical financial performance (2 of 2)
Exceptional spend (at actual rates)
System related spend ($m)
Other integration costs ($m)
Total HPE Software related exceptional spend
Other exceptional costs ($m)
Total (reported in operating profit)
Impairment Charge*
Total Exceptional Costs**
Adjusted cash conversion*
Free cash flow ($m)
Net debt ($m)**
***
****
FY 20
100.6
83.9
184.5
27.9
212.4
2,799.2
3,011.6
112.6%
511.2
4,153.5
FY 19 Change %
3.5x
126.3
168.0
294.3
(0.1)
294.2
294.2
95.3%
563.3
4,608.3
3.2x
(20.3%)
(50.1%)
(37.3%)
Net debt to Adjusted EBITDA ratio
* $2,799.2m impairment of goodwill in FY 20
** Exceptional costs for H1 20 exclude the loss from discontinued operation relating to the disposal of SUSE of $2.7m
*** Defined as cash generated from operations divided by Adjusted EBITDA less exceptional items and excluding any goodwill impairment charge
**** Including IFRS 16 lease liabilities
n.m.
(27.8%)
n.m.
17.3ppt
(9.2%)
H1’21
29.2
15.3
44.5
98.5
143.0
143.0
124.5%
139.5
4,118.4
3.6x
H1’20
71.5
54.7
126.2
126.2
922.2
1,048.4
131.5%
304.9
4,312.0
3.4x
Change %
(59.2%)
(72.0%)
(64.7%)
13.3%
(86.4%)
7.Oppt
(54.6%)
MICROⓇ
FOCUSView entire presentation