Taboola Investor Presentation Deck
GROWTH DRIVEN BY CORE
OPEN WEB INSTALLED BASE
2
ex-TAC Gross Profit Growth %
Net Dollar Retneion (%)
30%
20%
10%
0%
-10%
-20%
140%
130%
120%
110%
100%
90%
80%
Taboola
18%
2018
114%
2018
New Publisher ex-TAC Gross Profit
1%
Outliers
2019
104%
11%
2019
2020
Net Dollar Retention (ex-TAC Gross Profit)
118%
2020
10%
2021
(Pro Forma)
115%
2021
(Pro Forma)
6%
2022
(Pro Forma)
93%
2022
(Pro Forma)
CONTINUED
GROWTH
FROM NEW
SUPPLY...
HELPS PROVIDE
FUEL FOR
GROWTH FROM
A STRONG
INSTALLED
BASE.
2
New Publisher¹ ex-TAC
Gross Profit
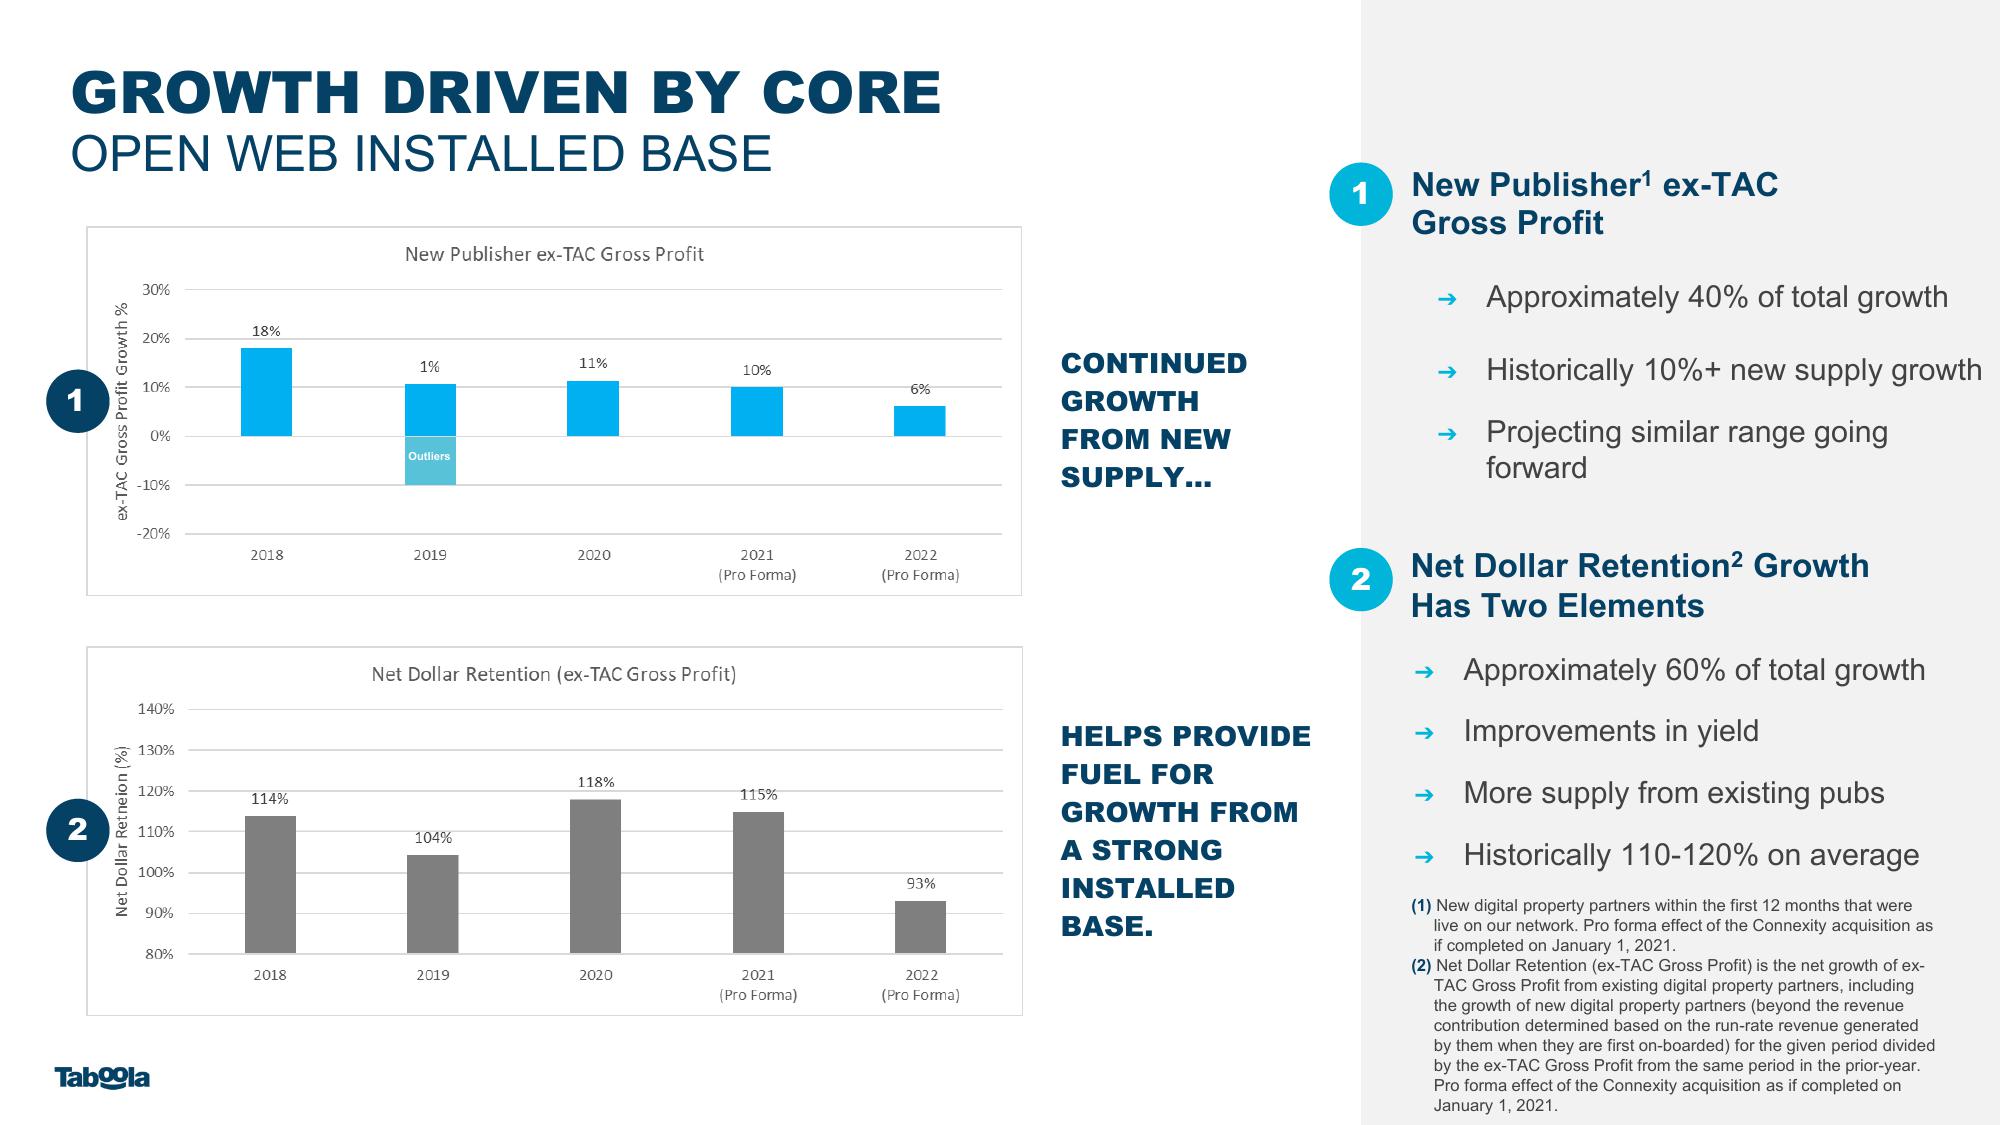
Approximately 40% of total growth
→ Historically 10%+ new supply growth
→ Projecting similar range going
forward
Net Dollar Retention² Growth
Has Two Elements
Approximately 60% of total growth
→ Improvements in yield
➜>> More supply from existing pubs
→ Historically 110-120% on average
(1) New digital property partners within the first 12 months that were
live on our network. Pro forma effect of the Connexity acquisition as
if completed on January 1, 2021.
(2) Net Dollar Retention (ex-TAC Gross Profit) is the net growth of ex-
TAC Gross Profit from existing digital property partners, including
the growth of new digital property partners (beyond the revenue
contribution determined based on the run-rate revenue generated
by them when they are first on-boarded) for the given period divided
by the ex-TAC Gross Profit from the same period in the prior-year.
Pro forma effect of the Connexity acquisition as if completed on
January 1, 2021.View entire presentation