Barclays Investment Banking Pitch Book
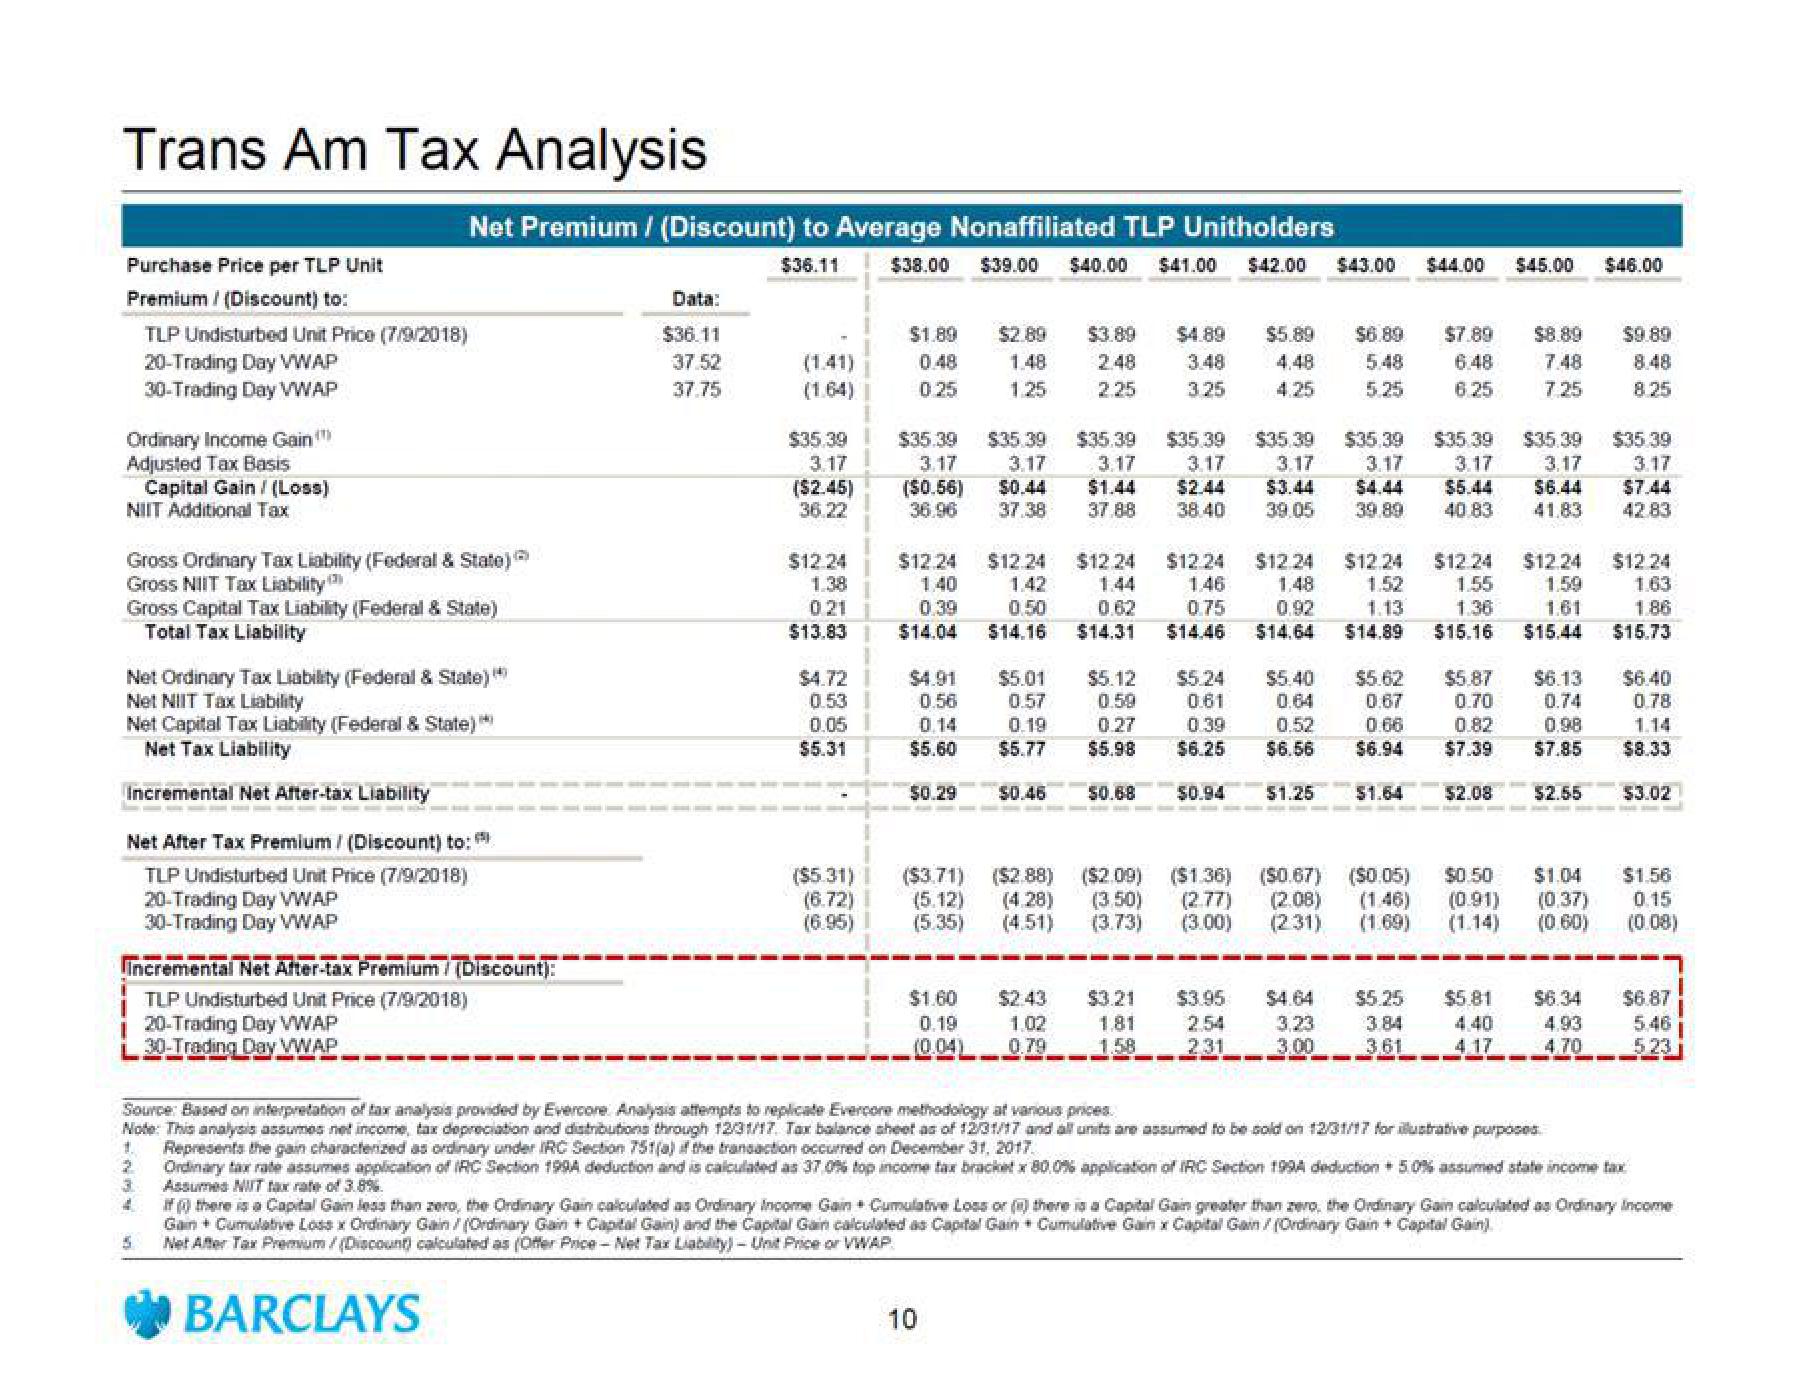
Trans Am Tax Analysis
Purchase Price per TLP Unit
Premium / (Discount) to:
TLP Undisturbed Unit Price (7/9/2018)
20-Trading Day VWAP
30-Trading Day VWAP
Ordinary Income Gain
Adjusted Tax Basis
Capital Gain/ (Loss)
NIIT Additional Tax
Gross Ordinary Tax Liability (Federal & State)
Gross NIIT Tax Liability
Gross Capital Tax Liability (Federal & State)
Total Tax Liability
Net Premium / (Discount) to Average Nonaffiliated TLP Unitholders
$36.11
Net Ordinary Tax Liability (Federal & State)"
Net NIIT Tax Liability
Net Capital Tax Liability (Federal & State) **)
Net Tax Liability
Incremental Net After-tax Liability
Net After Tax Premium / (Discount) to:
TLP Undisturbed Unit Price (7/9/2018)
20-Trading Day VWAP
30-Trading Day VWAP
incremental Net After-tax Premium / (Discount):
TLP Undisturbed Unit Price (7/9/2018)
20-Trading Day VWAP
30-Trading Day VWAP
5
Data:
$36.11
37.52
37.75
BARCLAYS
(1.41)
(1.64)
$35.39
3.17
($2.45)
36.22
$4.72
0.53
0.05
$5.31
$38.00 $39.00 $40.00 $41.00 $42.00 $43.00 $44.00 $45.00 $46.00
($5.31)
(6.72)
(6.95)
$1.80 $2.89
0.48 1.48
0.25 1.25
$35.39
3.17
($0.56)
36.96
$4.91
0.56
0.14
$5.60
$0.29
$3.89 $4.89
2.48 3.48
2.25 3.25
$35.39 $35.39 $35.39
3.17 3.17
$0.44 $1.44
37.38 37.88
$12.24
$12,24 $12.24 $12.24 $12.24 $12.24 $12,24 $12.24 $12.24
1.38
1.40 1.42
1.46 1.48 1.52 1.55 1.59
021
0.39 0.50
0.75 0.92 1.13 1.36
$13.83 1 $14.04 $14.16
$14.64 $14.89 $15.16
$14.31 $14.46
$5.01 $5.12
0.57
0.59
0.19
0.27
$5.77 $5.98
$0.46 $0.68
$1.60 $2.43
0.19 1.02
(0.04) 0.79
10
$5.89 $6.89 $7.89
4.48 5.48
4.25 5.25
6.48
6.25
$35.39 $35.39
3.17 3.1
3.17
$2.44 $3.44 $4.44
38.40 39.05 39.89
$3.21
1.81
1.58
$5.24
$5.40 $5.62
0.64
0.67
$5.87
0.70
0.61
0.39
0.52
0.66
0.82
$6.25 $6.56
$6.94
$7.39
$1.64 $2.08
$0.94 $1.25
$3.95
254
231
$35.39 $35.39
3.17
$5.44
40.83
3.17
$6.44
41.83
7.48
7.25
($3.71) ($2.88) ($2.09) ($1.36) ($0.67) ($0.05) $0.50 $1.04
(5.12) (4.28) (3.50) (2.77) (2.08) (1.46) (0.91) (0.37)
(5.35) (4.51) (3.73) (3.00) (231) (1.69) (1.14) (0.60)
$4.64
3,23
3.00
$15.44
$6.13
0.74
0.98
$7.85
Source: Based on interpretation of tax analysis provided by Evercore Analysis attempts to replicate Evercone methodology at various prices.
Note: This analysis assumes net income tax depreciation and distributions through 12/31/17. Tax balance sheet as of 12/31/17 and all units are assumed to be sold on 12/31/17 for illustrative purposes.
1. Represents the gain characterized as ordinary under IRC Section 751(a) if the transaction occurred on December 31, 2017.
$2.55
$5.25 $5.81 $6.34
3.84
4.40
4.93
3.61
4.70
$9.89
8.25
$35.39
3.17
$7.44
42.83
$12 24
1.63
1.86
$15.73
$6.40
0.78
1.14
$8.33
$3.02
2 Ordinary tax rate assumes application of IRC Section 199A deduction and is calculated as 37.0% top income tax bracket x 80.0% application of IRC Section 1994 deduction+ 5.0% assumed state income tax
3 Assumes NIT tax rate of 3.8%.
4
If there is a Capital Gain less than zero, the Ordinary Gain calculated as Ordinary Income Gan Cumulative Loss or () there is a Capital Gain greater than zero, the Ordinary Gain calculated as Ordinary Income
Gain + Cumulative Loss x Ordinary Gain/ (Ordinary Gain + Capital Gain) and the Capital Gain calculated as Capital Gain Cumulative Gain x Capital Gain/ (Ordinary Gain + Capital Gain)
Net After Tax Premium/(Discount) calculated as (Offer Price-Net Tax Liability) - Unit Price or VWAP
$1.56
0.15
(0.08)
$6.87
546
523View entire presentation