REE SPAC Presentation Deck
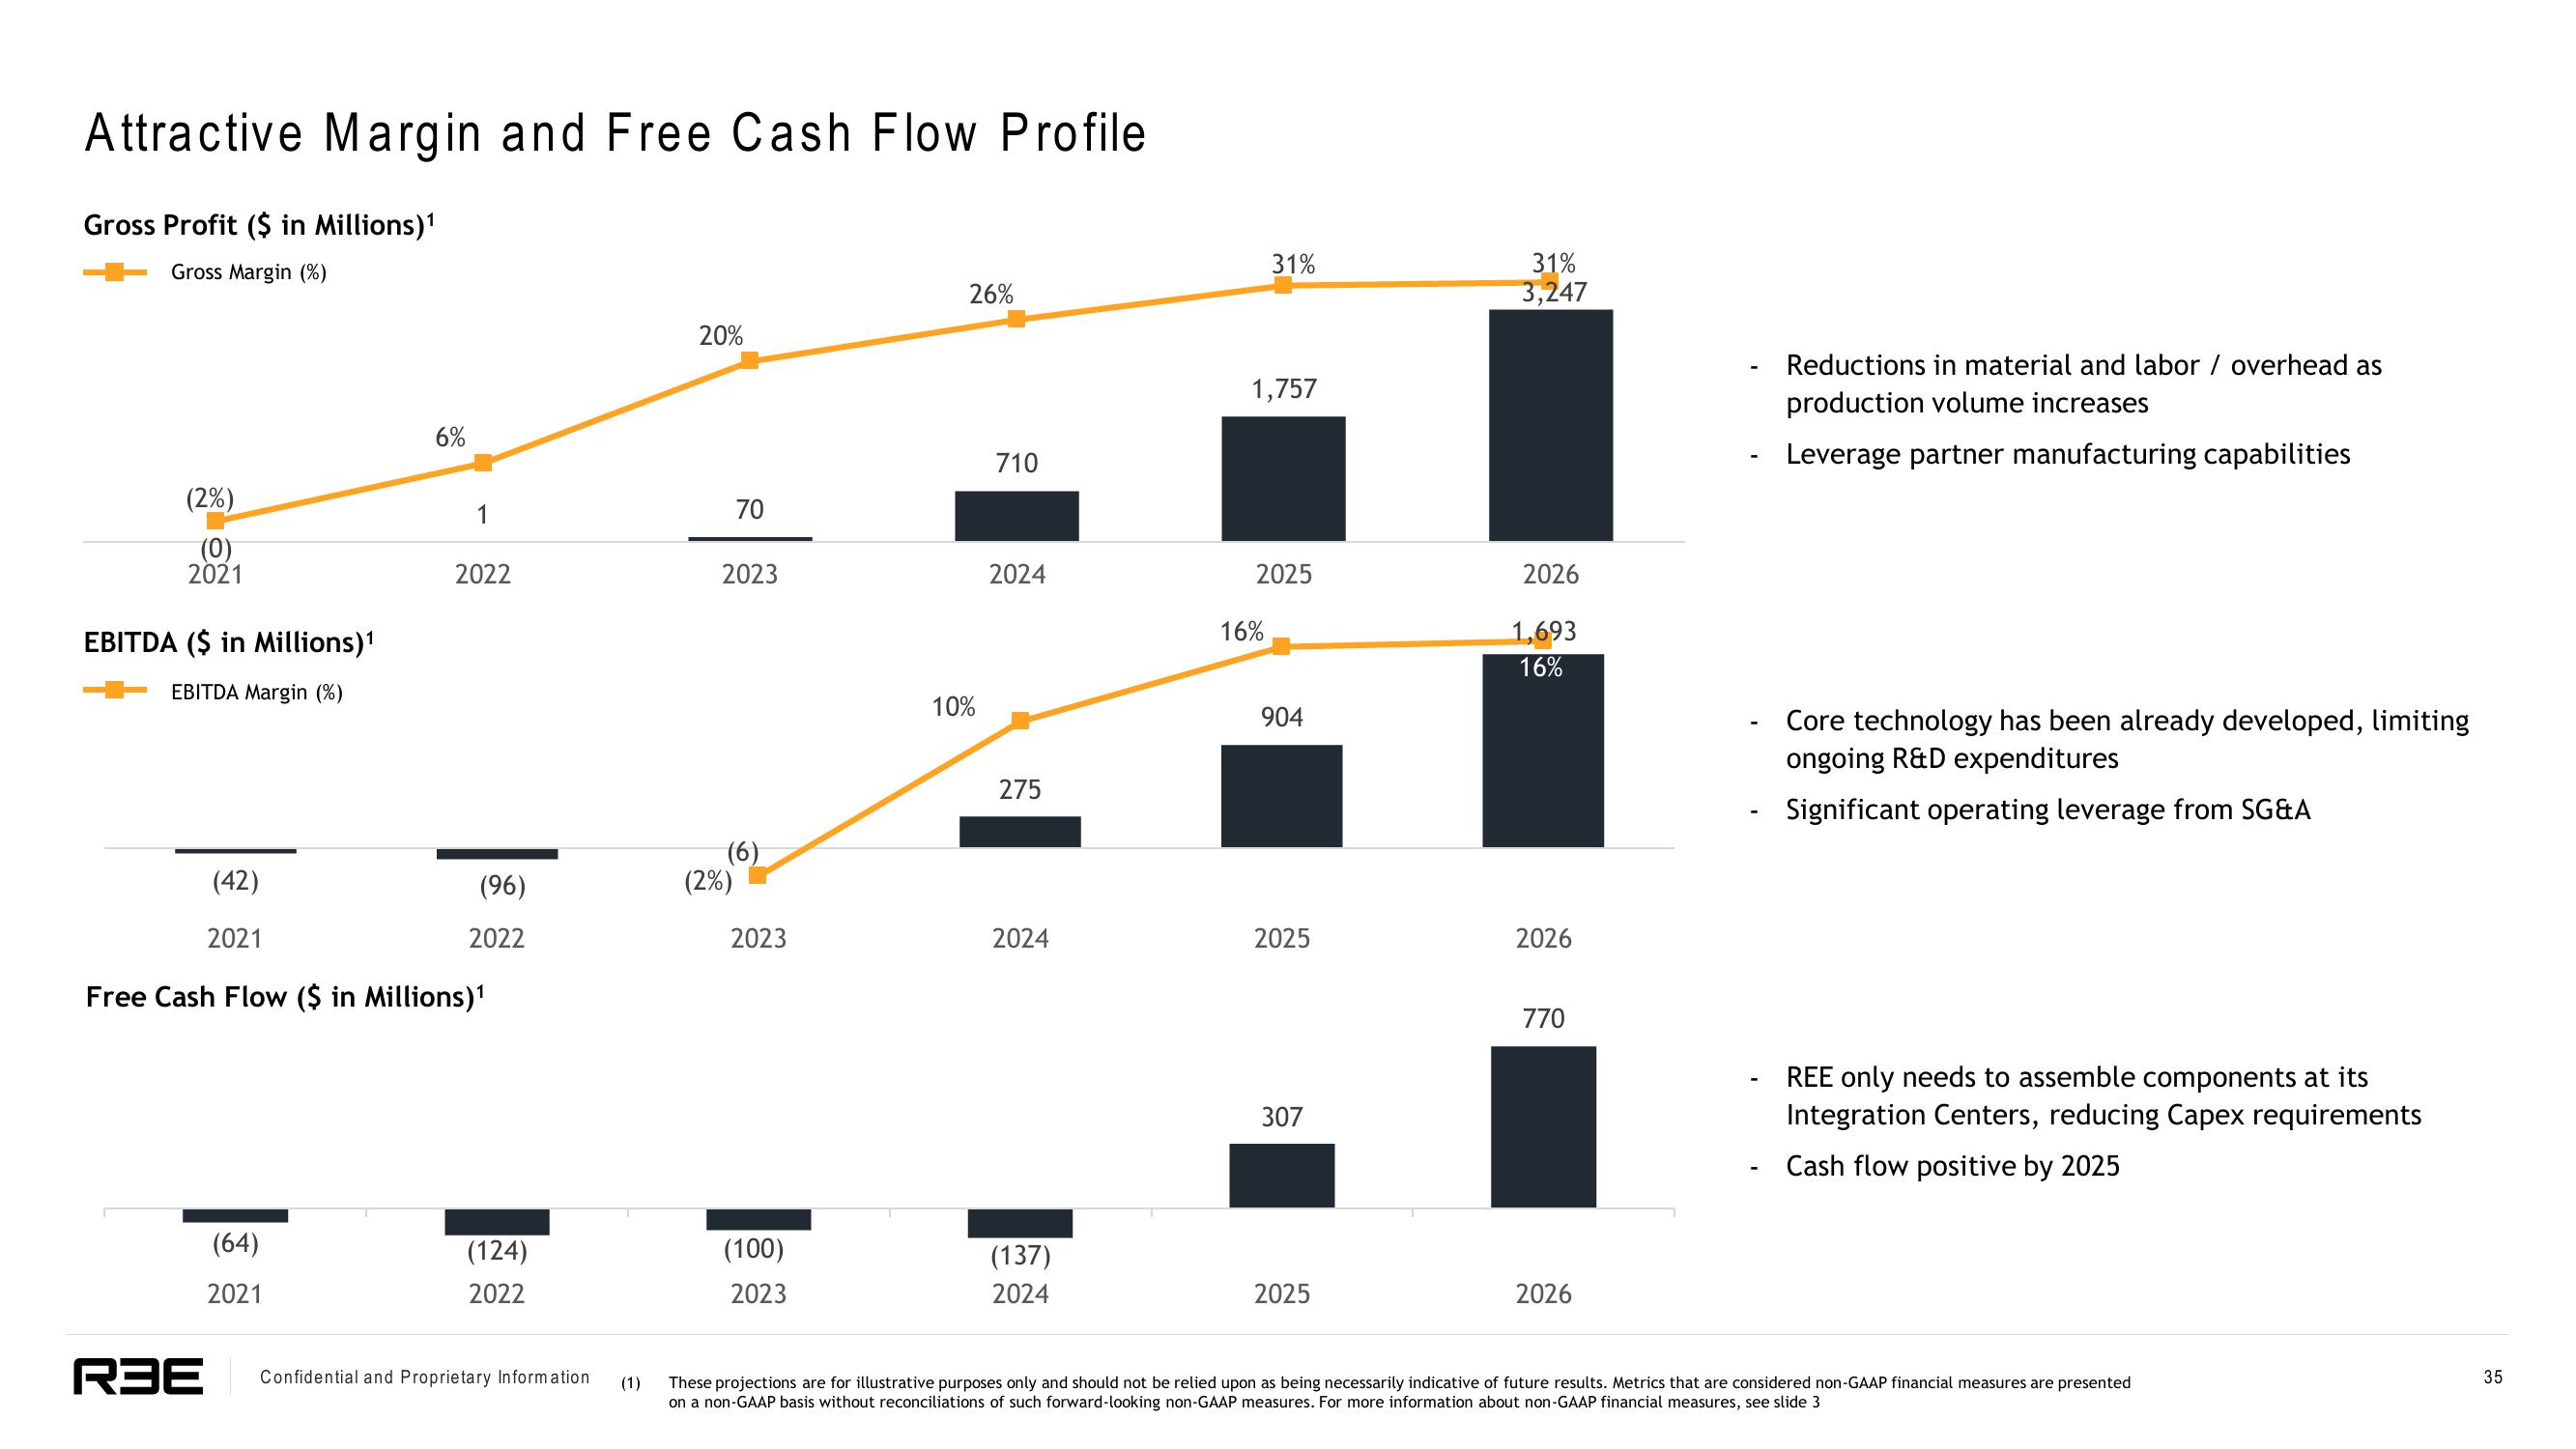
Attractive Margin and Free Cash Flow Profile
Gross Profit ($ in Millions)¹
Gross Margin (%)
(2%)
(0)
2021
EBITDA ($ in Millions) ¹
EBITDA Margin (%)
6%
(64)
2021
2022
(42)
2021
Free Cash Flow ($ in Millions) ¹
(96)
2022
(124)
2022
RBE Confidential and Proprietary Information
(1)
20%
70
2023
(6)
(2%)
2023
(100)
2023
26%
10%
710
2024
275
2024
(137)
2024
31%
1,757
2025
16%
904
2025
307
2025
31%
3,247
2026
1,693
16%
2026
770
2026
Reductions in material and labor / overhead as
production volume increases
Leverage partner manufacturing capabilities
Core technology has been already developed, limiting
ongoing R&D expenditures
Significant operating leverage from SG&A
REE only needs to assemble components at its
Integration Centers, reducing Capex requirements
Cash flow positive by 2025
These projections are for illustrative purposes only and should not be relied upon as being necessarily indicative of future results. Metrics that are considered non-GAAP financial measures are presented
on a non-GAAP basis without reconciliations of such forward-looking non-GAAP measures. For more information about non-GAAP financial measures, see slide 3
35View entire presentation