NewFortress Energy Results Presentation Deck
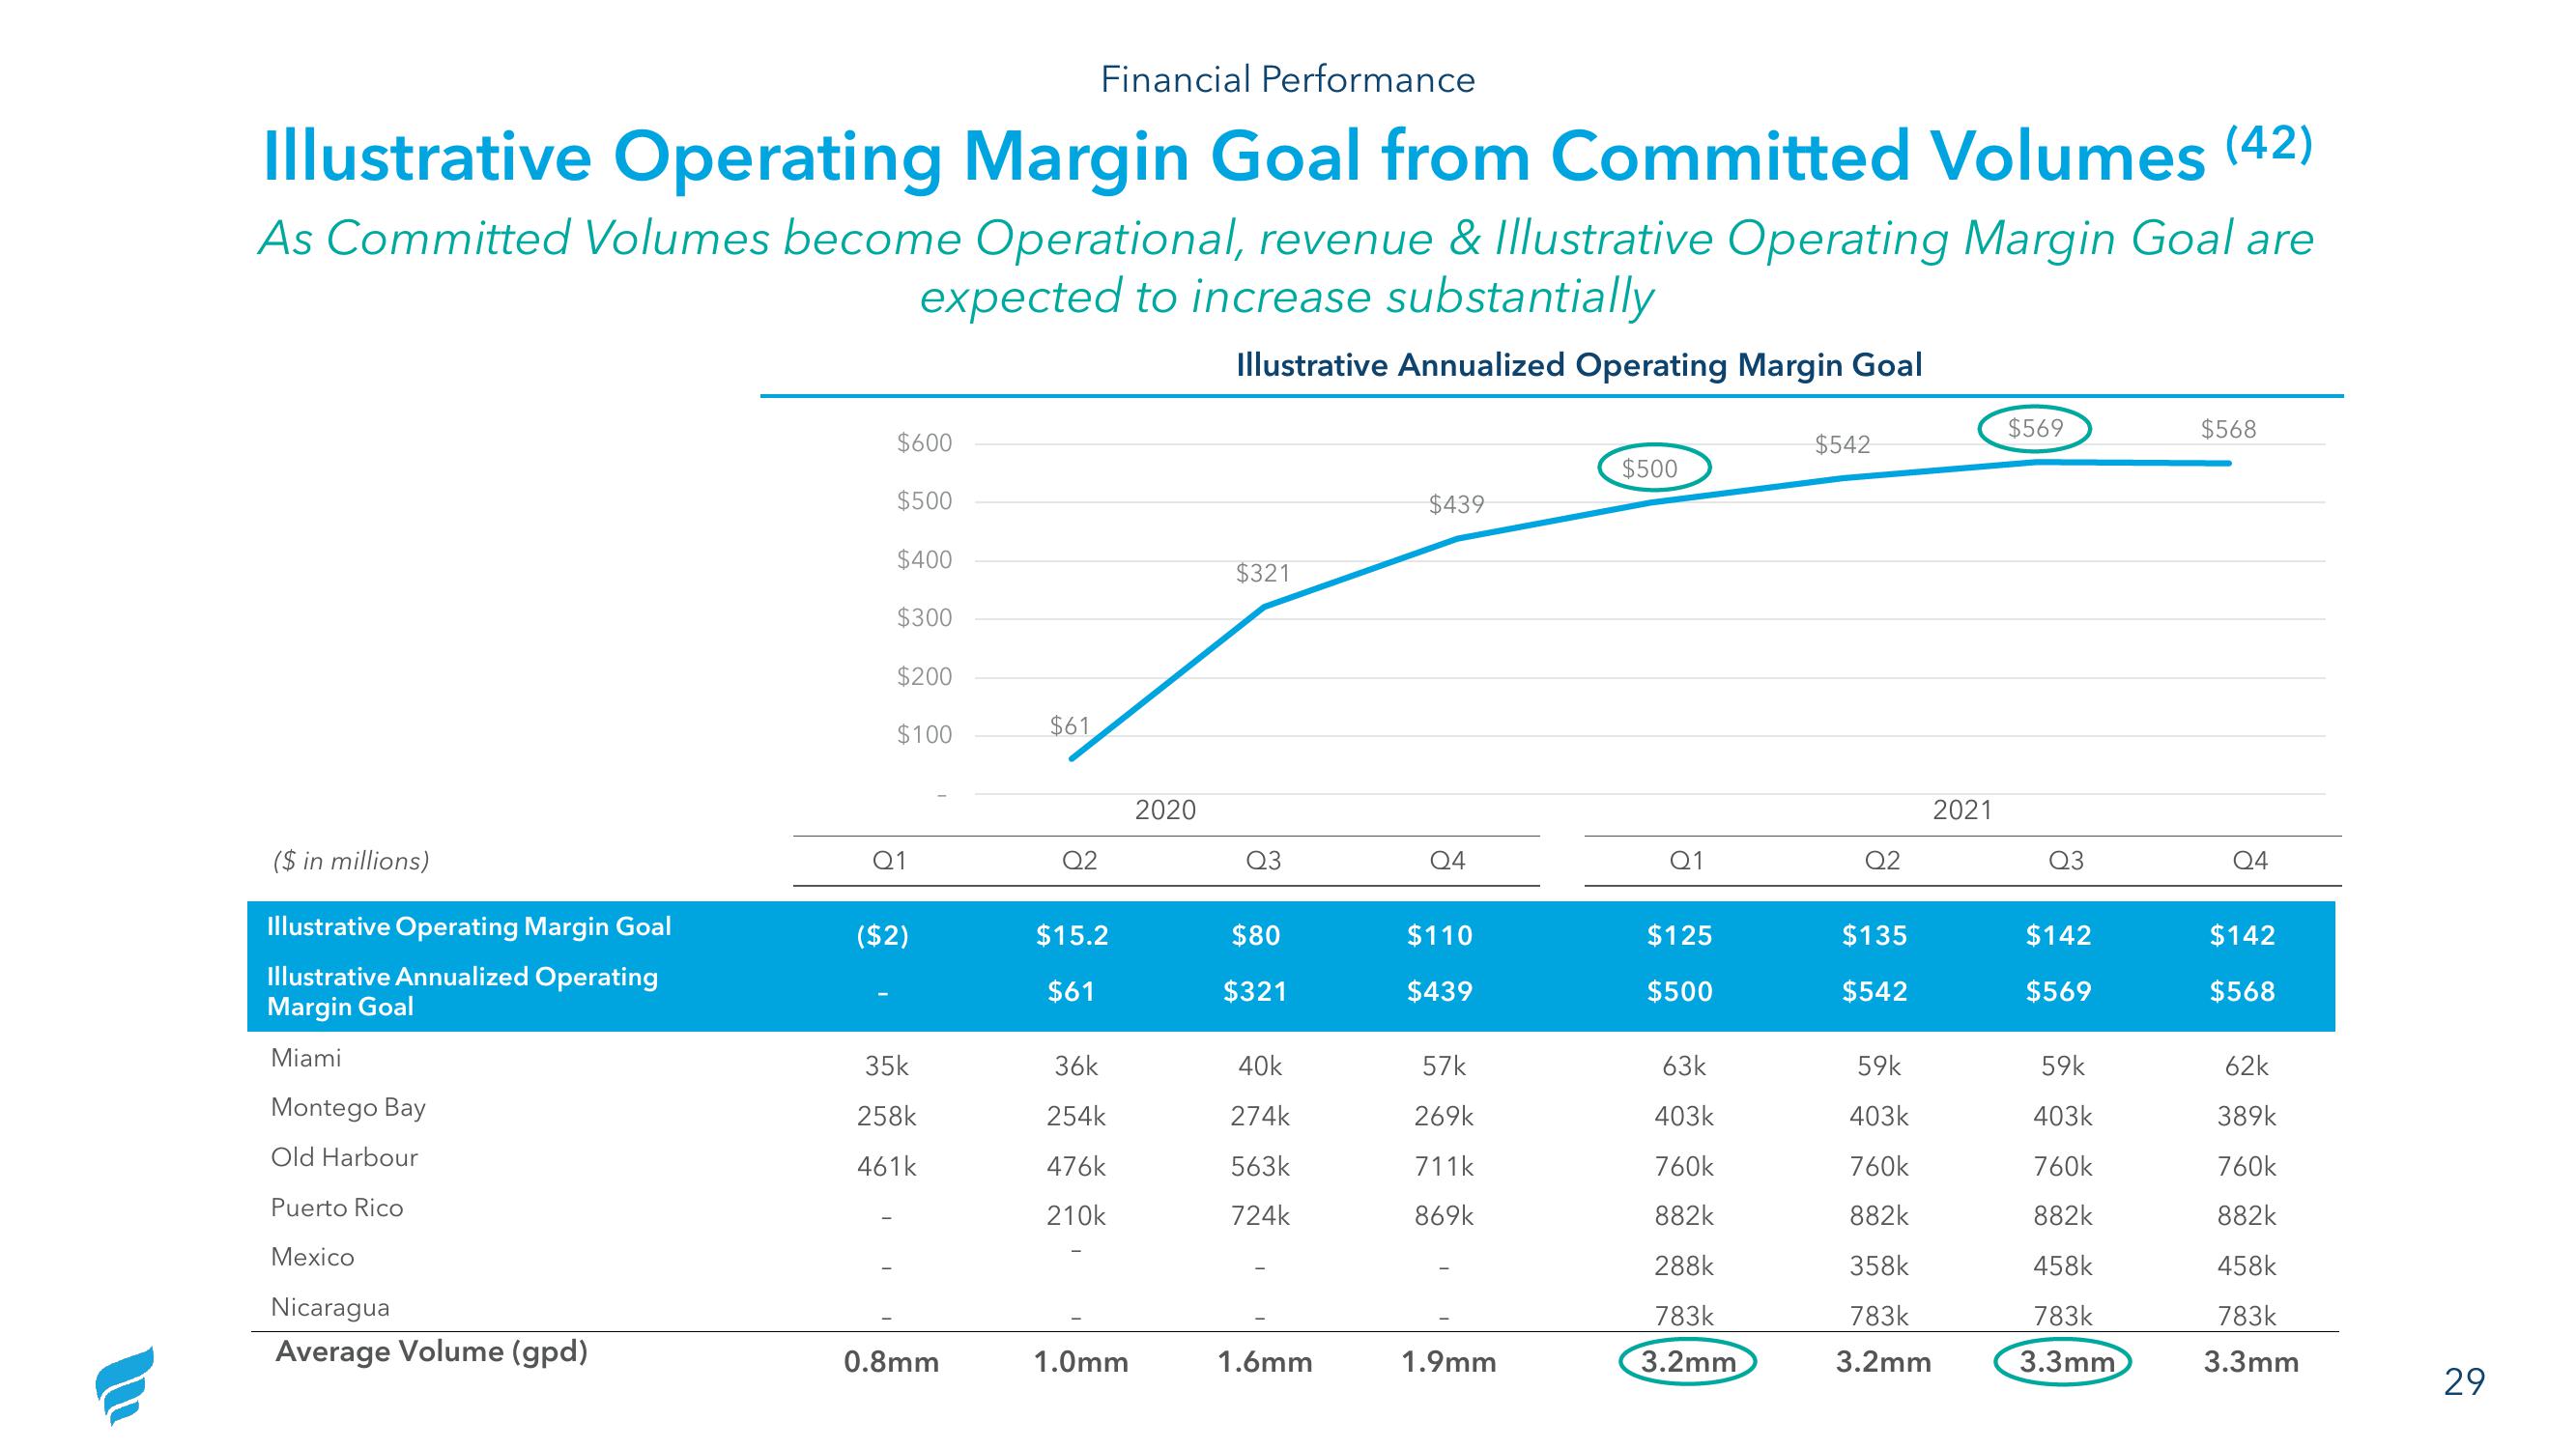
Illustrative Operating Margin Goal from Committed Volumes (42)
As Committed Volumes become Operational, revenue & Illustrative Operating Margin Goal are
expected to increase substantially
Illustrative Annualized Operating Margin Goal
($ in millions)
Illustrative Operating Margin Goal
Illustrative Annualized Operating
Margin Goal
Miami
Montego Bay
Old Harbour
Puerto Rico
Mexico
Nicaragua
Average Volume (gpd)
$600
$500
$400
$300
$200
$100
Q1
($2)
35k
258k
461k
0.8mm
$61
Financial Performance
Q2
$15.2
$61
36k
254k
476k
210k
1.0mm
2020
$321
Q3
$80
$321
40k
274k
563k
724k
1.6mm
$439
Q4
$110
$439
57k
269k
711k
869k
1.9mm
$500
Q1
$125
$500
63k
403k
760k
882k
288k
783k
3.2mm
$542
Q2
$135
$542
59k
403k
760k
882k
358k
783k
3.2mm
2021
$569
Q3
$142
$569
59k
403k
760k
882k
458k
783k
3.3mm
$568
Q4
$142
$568
62k
389k
760k
882k
458k
783k
3.3mm
29View entire presentation