Deliveroo Results Presentation Deck
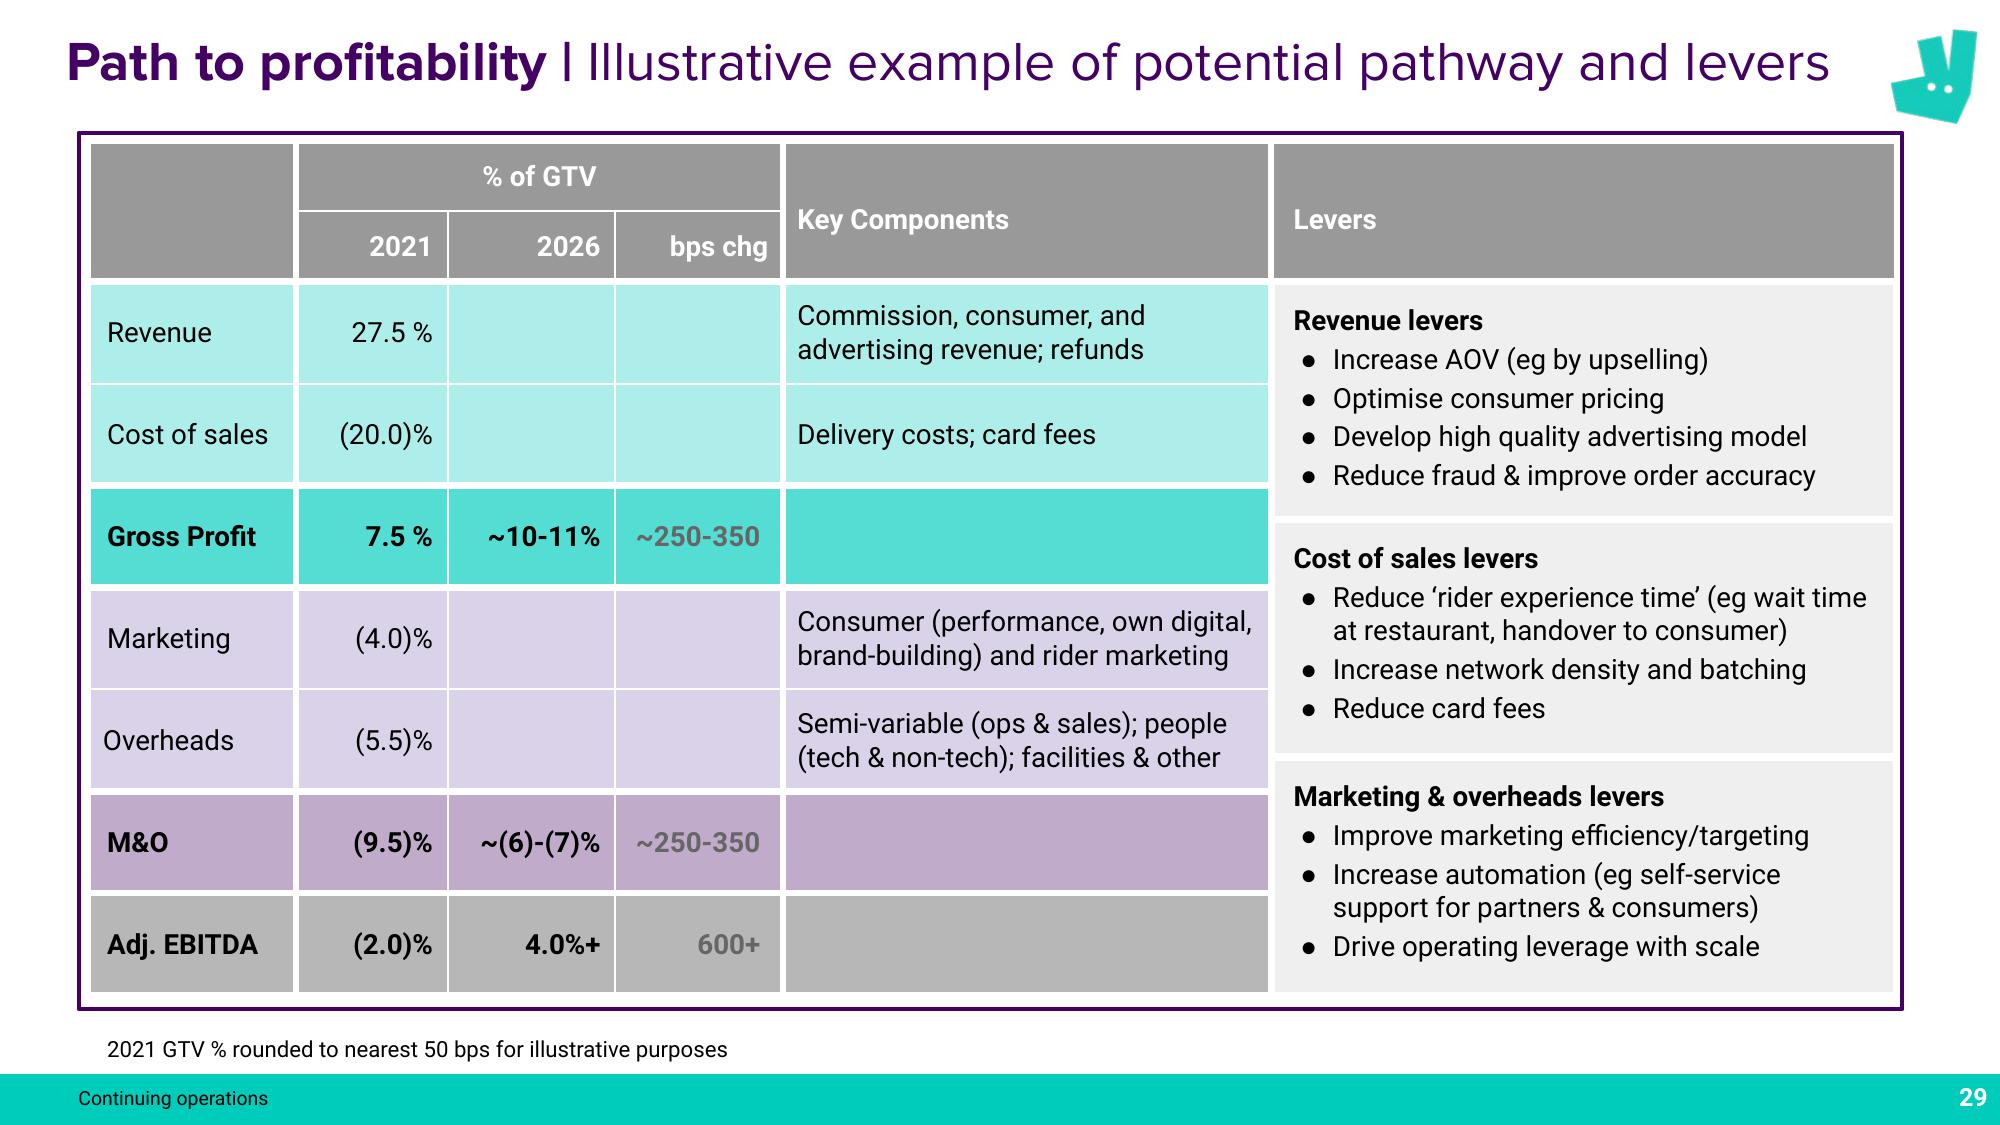
Path to profitability I Illustrative example of potential pathway and levers
Revenue
Cost of sales
Gross Profit
Marketing
Overheads
M&O
Adj. EBITDA
2021
27.5%
(20.0)%
(4.0)%
(5.5)%
% of GTV
7.5% ~10-11% ~250-350
2026
(2.0)%
bps chg
(9.5)% ~(6)-(7)% ~250-350
4.0%+
600+
2021 GTV % rounded to nearest 50 bps for illustrative purposes
Continuing operations
Key Components
Commission, consumer, and
advertising revenue; refunds
Delivery costs; card fees
Consumer (performance, own digital,
brand-building) and rider marketing
Semi-variable (ops & sales); people
(tech & non-tech); facilities & other
Levers
Revenue levers
• Increase AOV (eg by upselling)
• Optimise consumer pricing
• Develop high quality advertising model
Reduce fraud & improve order accuracy
Cost of sales levers
• Reduce 'rider experience time' (eg wait time
at restaurant, handover to consumer)
• Increase network density and batching
Reduce card fees
Marketing & overheads levers
• Improve marketing efficiency/targeting
• Increase automation (eg self-service
support for partners & consumers)
• Drive operating leverage with scale
29View entire presentation