Main Street Capital Investor Day Presentation Deck
Dividend Paying BDCs
Public for >2 Years (3)
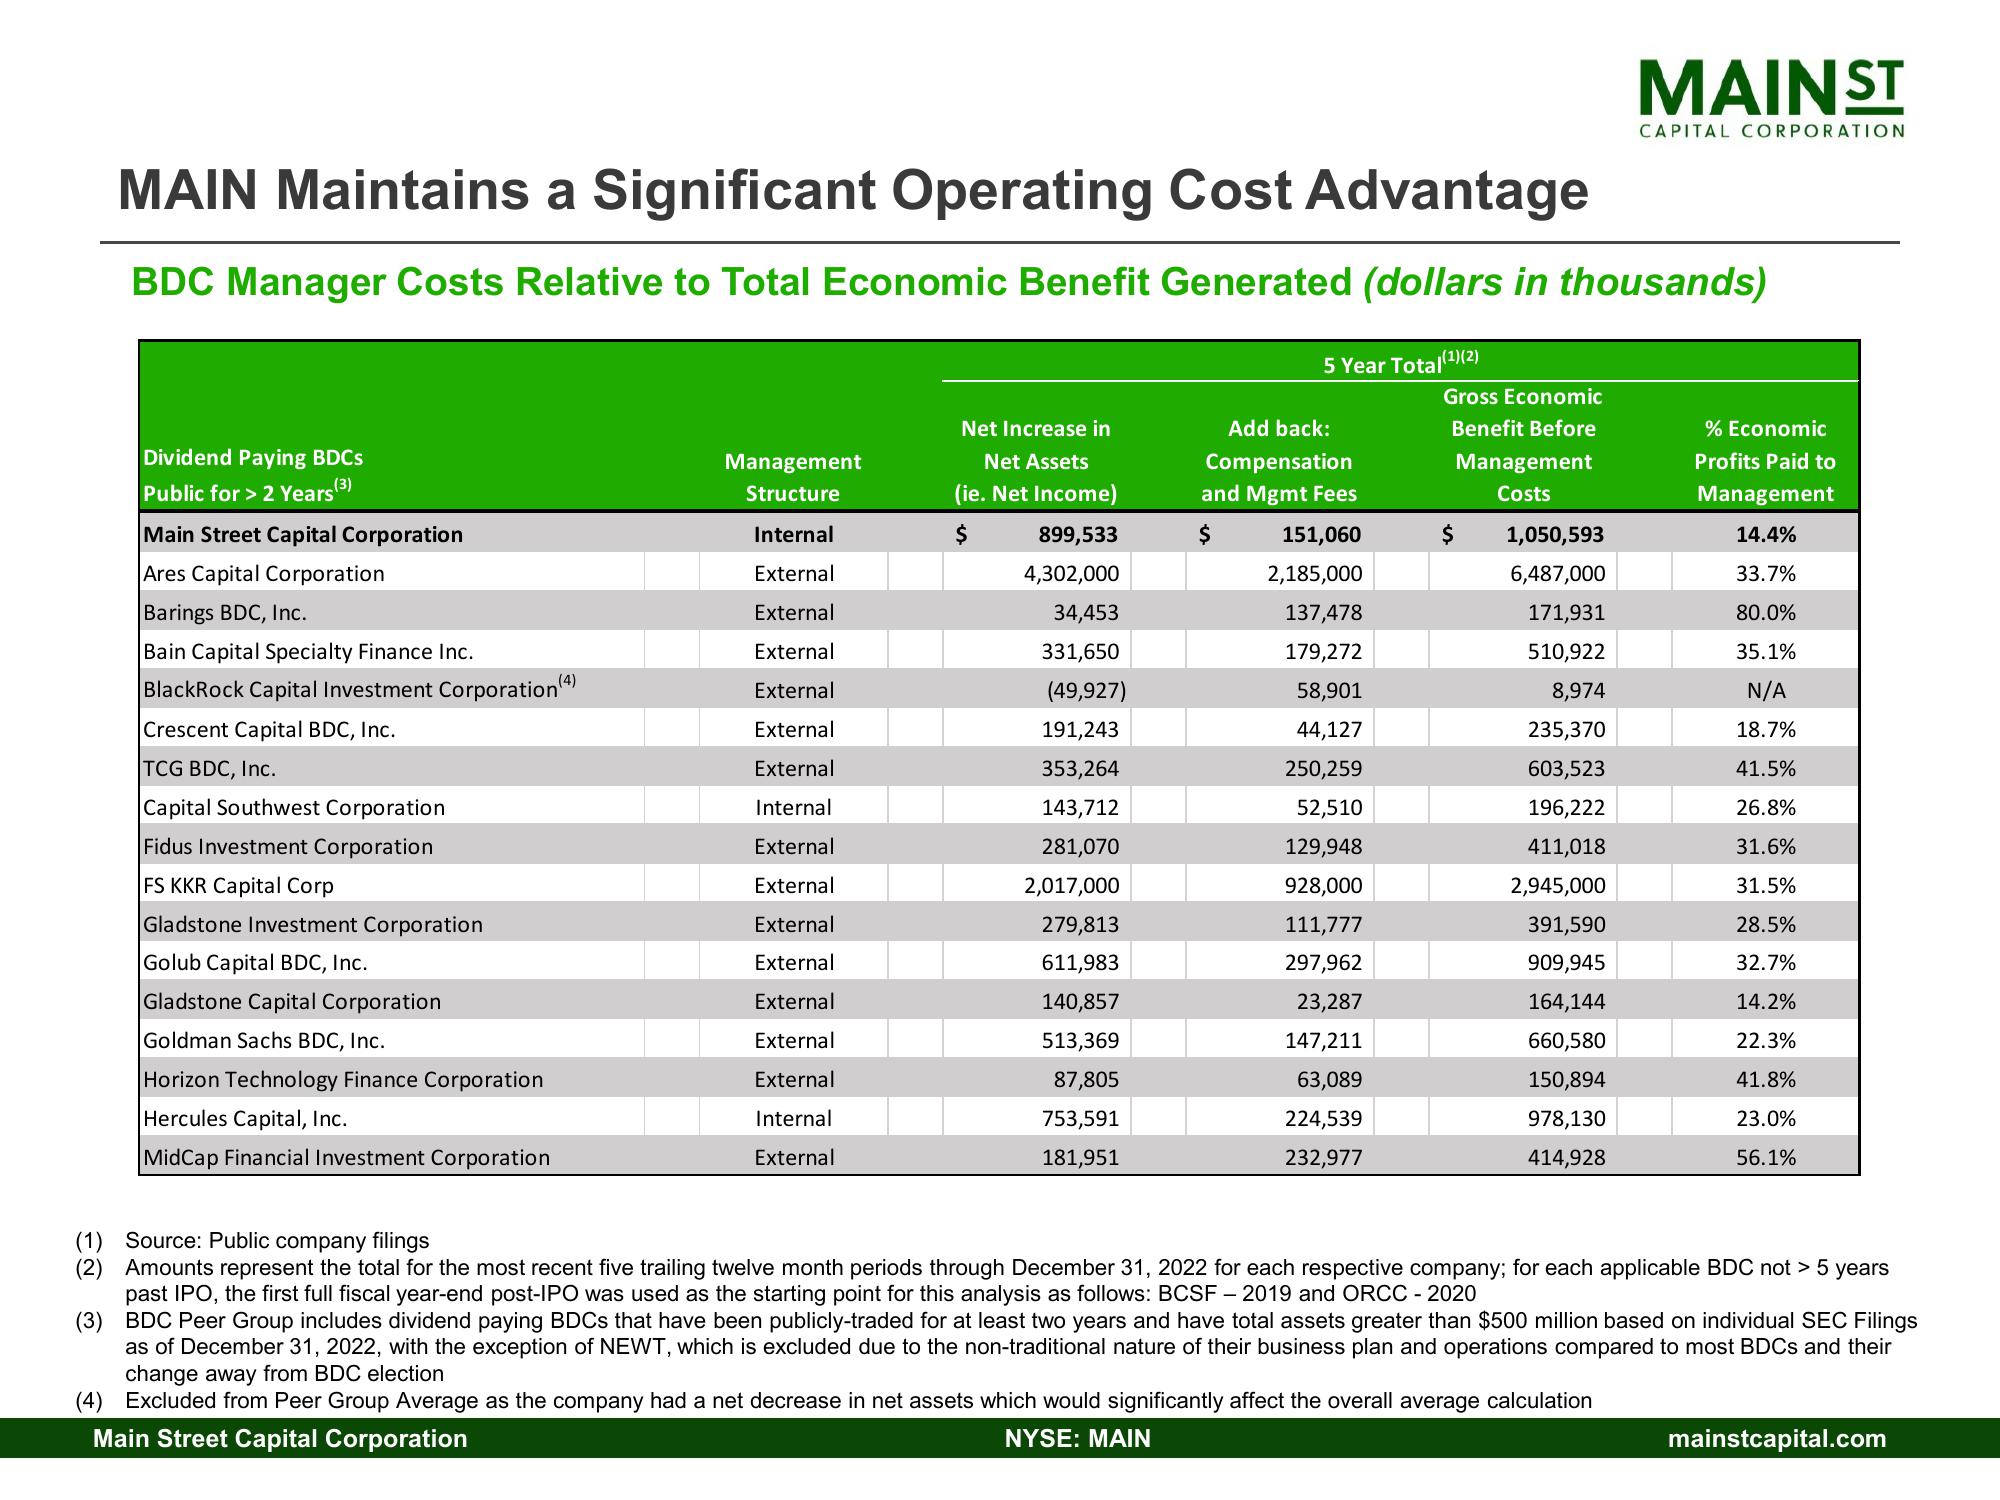
MAIN Maintains a Significant Operating Cost Advantage
BDC Manager Costs Relative to Total Economic Benefit Generated (dollars in thousands)
Main Street Capital Corporation
Ares Capital Corporation
Barings BDC, Inc.
Bain Capital Specialty Finance Inc.
BlackRock Capital Investment Corporation (4)
Crescent Capital BDC, Inc.
TCG BDC, Inc.
Capital Southwest Corporation
Fidus Investment Corporation
FS KKR Capital Corp
Gladstone Investment Corporation
Golub Capital BDC, Inc.
Gladstone Capital Corporation
Goldman Sachs BDC, Inc.
Horizon Technology Finance Corporation
Hercules Capital, Inc.
MidCap Financial Investment Corporation
M
ment
Structure
Internal
External
External
External
External
External
External
Internal
External
External
External
External
External
External
External
Internal
External
Net Increase in
Net Assets
(ie. Net Income)
$ 899,533
4,302,000
34,453
331,650
(49,927)
191,243
353,264
143,712
281,070
2,017,000
279,813
611,983
140,857
513,369
87,805
753,591
181,951
5 Year Total(¹)(2)
Add back:
Compensation
and Mgmt Fees
$ 151,060
2,185,000
137,478
179,272
58,901
44,127
250,259
52,510
129,948
928,000
111,777
297,962
23,287
147,211
63,089
224,539
232,977
Gross Economic
Benefit Before
Management
Costs
$
MAINST
1,050,593
6,487,000
171,931
510,922
8,974
235,370
603,523
196,222
411,018
2,945,000
391,590
909,945
164,144
660,580
150,894
978,130
414,928
CAPITAL CORPORATION
% Economic
Profits Paid
Management
14.4%
33.7%
80.0%
35.1%
N/A
18.7%
41.5%
26.8%
31.6%
31.5%
28.5%
32.7%
14.2%
22.3%
41.8%
23.0%
56.1%
(1) Source: Public company filings
(2) Amounts represent the total for the most recent five trailing twelve month periods through December 31, 2022 for each respective company; for each applicable BDC not > 5 years
past IPO, the first full fiscal year-end post-IPO was used as the starting point for this analysis as follows: BCSF - 2019 and ORCC - 2020
(3)
BDC Peer Group includes dividend paying BDCs that have been publicly-traded for at least two years and have total assets greater than $500 million based on individual SEC Filings
as of December 31, 2022, with the exception of NEWT, which is excluded due to the non-traditional nature of their business plan and operations compared to most BDCs and their
change away from BDC election
(4) Excluded from Peer Group Average as the company had a net decrease in net assets which would significantly affect the overall average calculation
Main Street Capital Corporation
NYSE: MAIN
mainstcapital.comView entire presentation