Barclays Capital 2010 Global Financial Services Conference
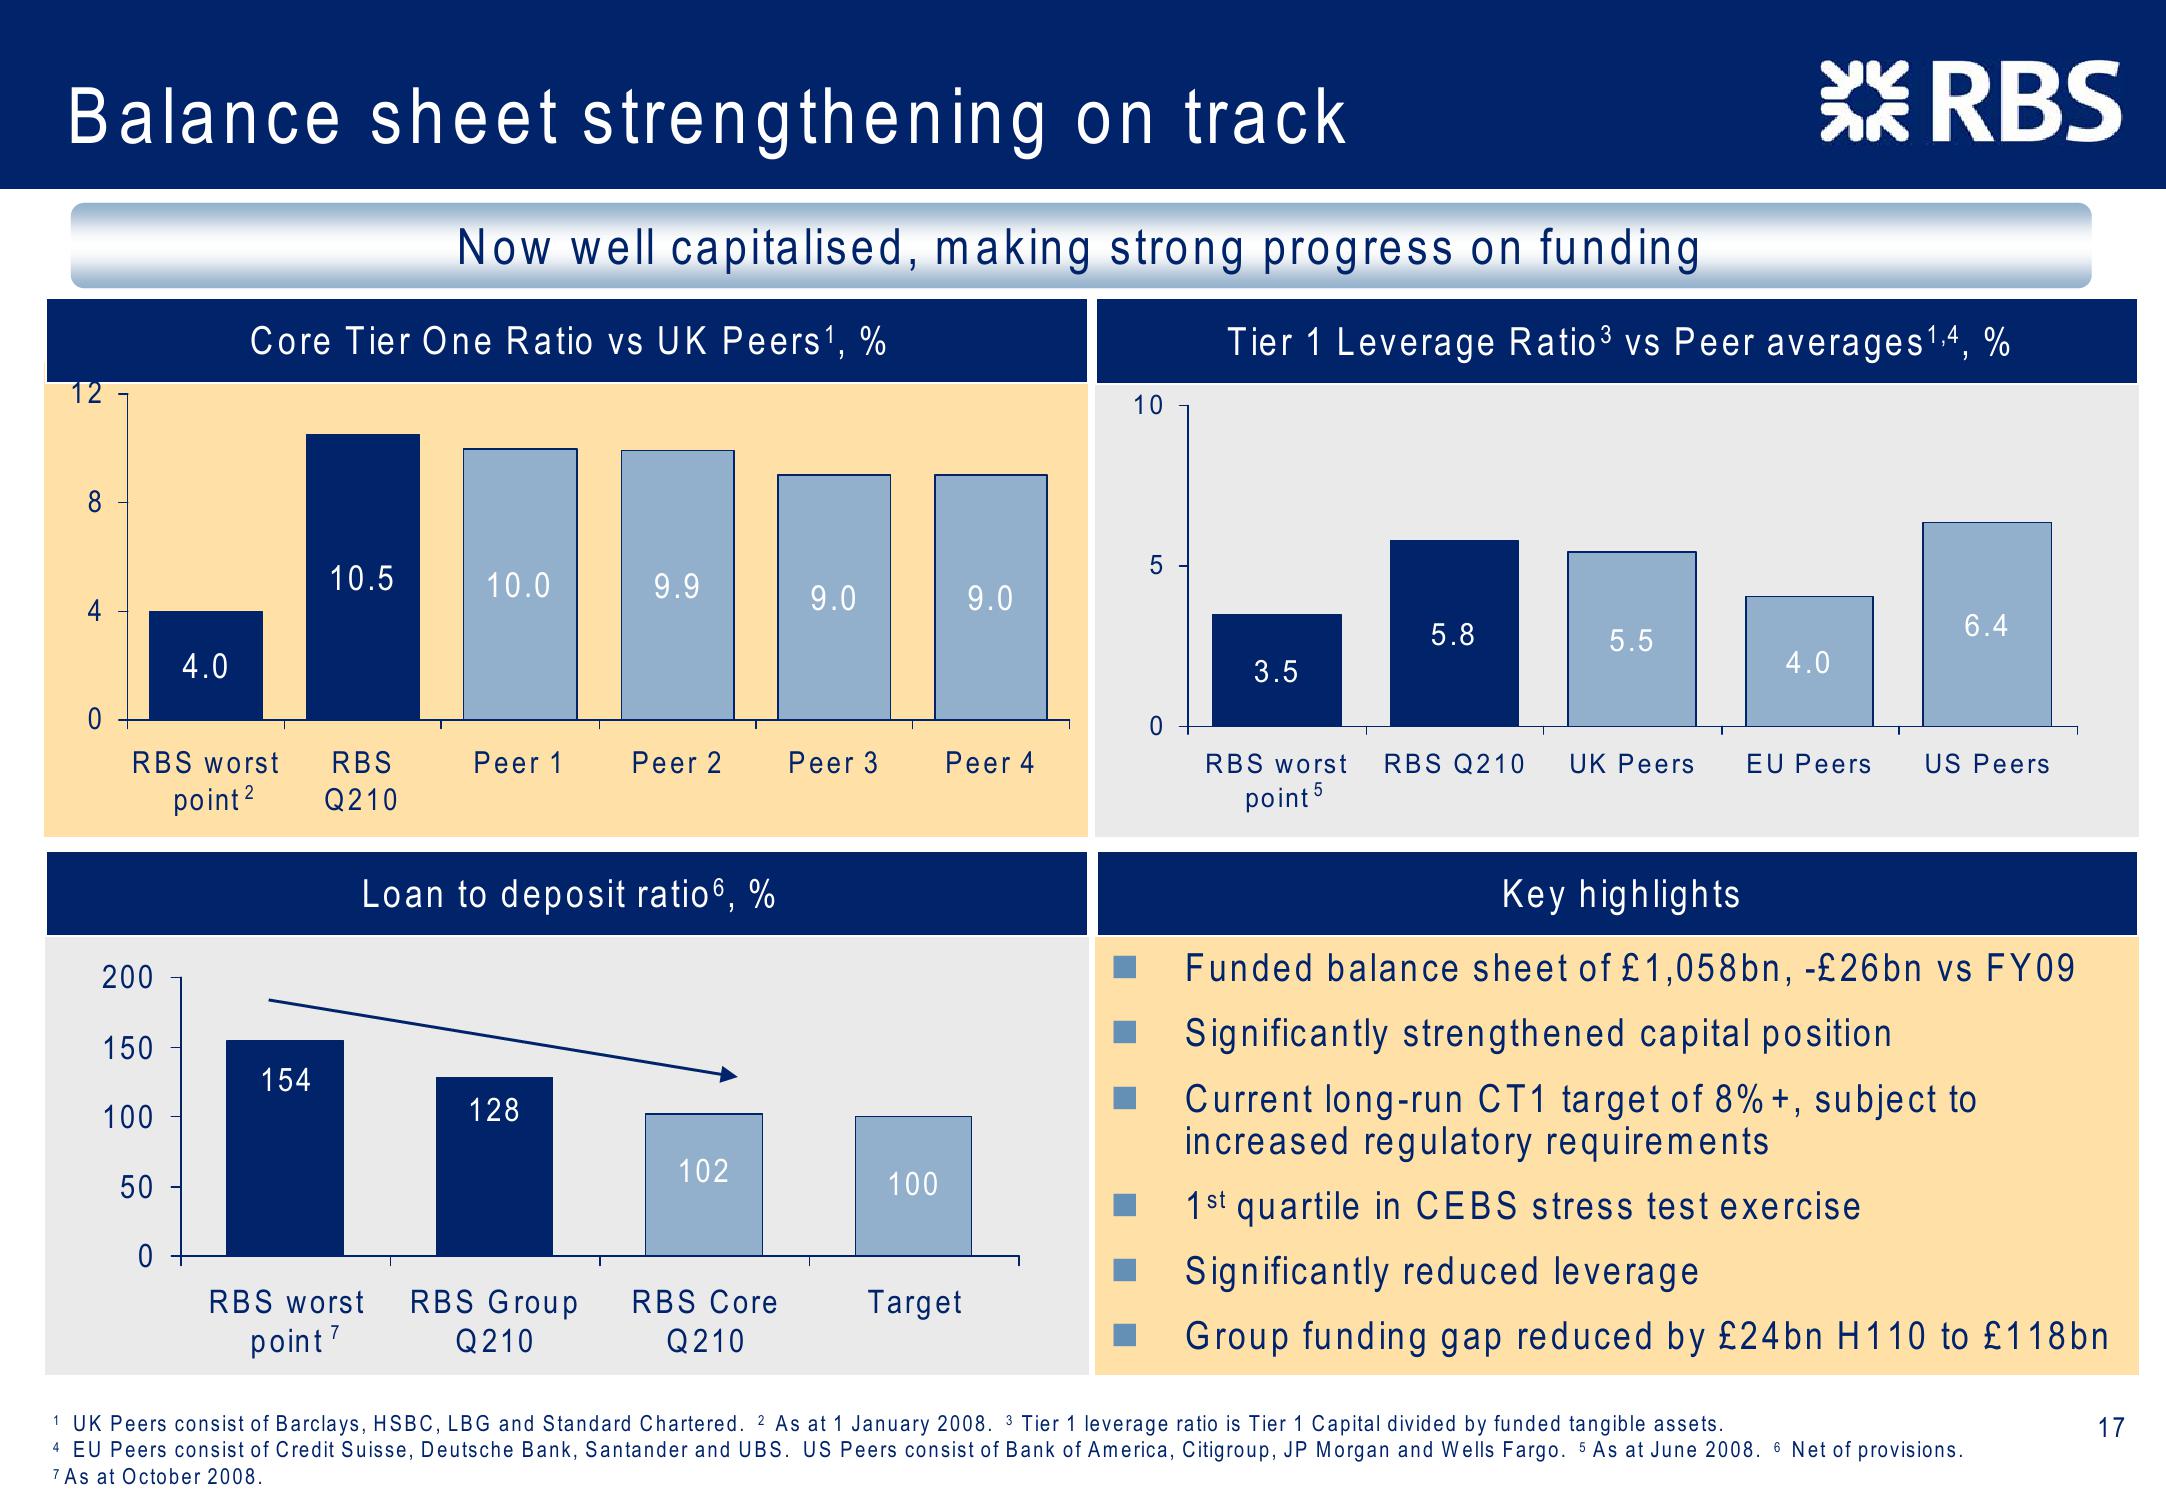
Balance sheet strengthening on track
12
Now well capitalised, making strong progress on funding
Core Tier One Ratio vs UK Peers¹, %
10
RBS
Tier 1 Leverage Ratio³ vs Peer averages 14, %
10.5
10.0
9.9
9.0
9.0
4.0
LO
5
5.8
6.4
5.5
3.5
4.0
0
RBS worst
point 2
RBS
Peer 1
Peer 2
Peer 3
Peer 4
Q210
RBS worst RBS Q210 UK Peers
point 5
EU Peers US Peers
Loan to deposit ratio6, %
200
150
154
100
128
102
50
100
0
RBS worst
point 7
RBS Group
Q210
RBS Core
Q210
Target
Key highlights
Funded balance sheet of £1,058bn, -£26bn vs FY09
Significantly strengthened capital position
Current long-run CT1 target of 8% +, subject to
increased regulatory requirements
1st quartile in CEBS stress test exercise
Significantly reduced leverage
Group funding gap reduced by £24bn H110 to £118bn
1 UK Peers consist of Barclays, HSBC, LBG and Standard Chartered. 2 As at 1 January 2008. 3 Tier 1 leverage ratio is Tier 1 Capital divided by funded tangible assets.
4 EU Peers consist of Credit Suisse, Deutsche Bank, Santander and UBS. US Peers consist of Bank of America, Citigroup, JP Morgan and Wells Fargo. 5 As at June 2008. 6 Net of provisions.
7 As at October 2008.
17View entire presentation