Investor Presentation
FINANCIALS
TECHNOLOGY
22
22
ENERGY EVOLUTION
NATURAL RESOURCES
INTRO
GROWING RETURNS
EARNINGS & CASHFLOW DELIVERY IN A STRONGER BALANCE SHEET
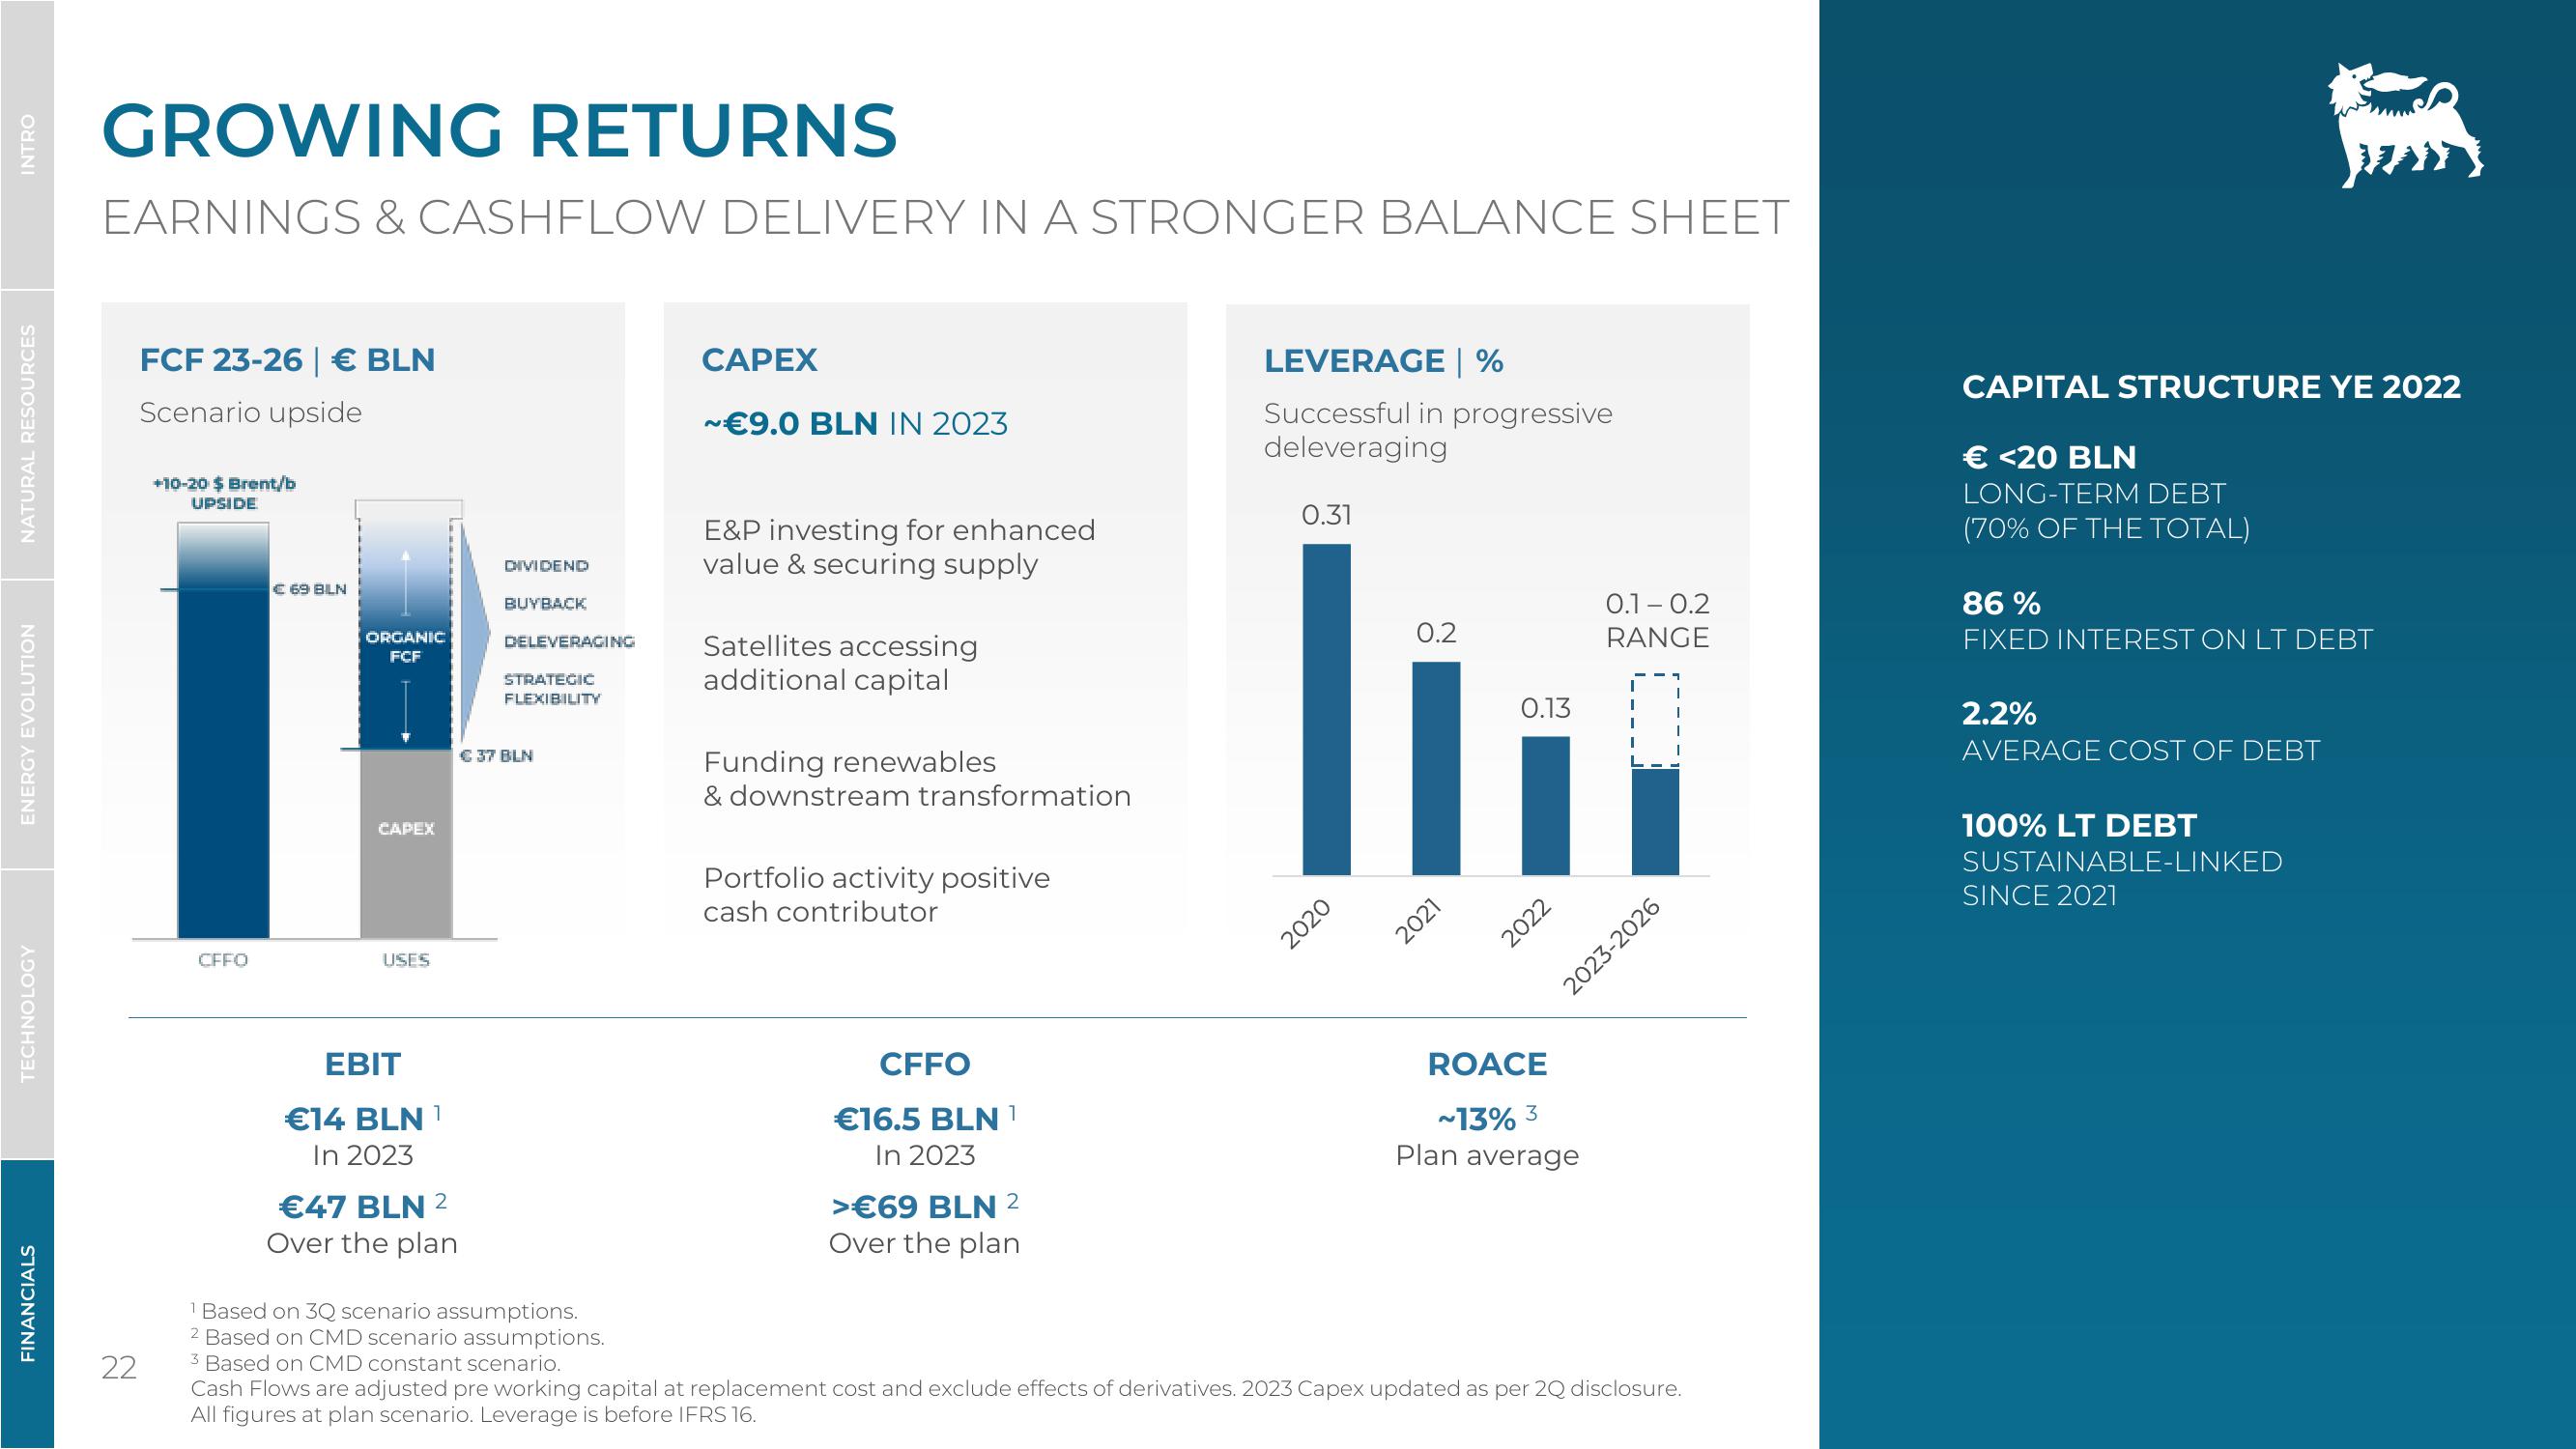
FCF 23-26 | € BLN
Scenario upside
+10-20 $ Brent/b
UPSIDE
CFFO
€69 BLN
ORGANIC
FCF
CAPEX
USES
DIVIDEND
BUYBACK
DELEVERAGING
STRATEGIC
FLEXIBILITY
€ 37 BLN
CAPEX
~€9.0 BLN IN 2023
E&P investing for enhanced
value & securing supply
Satellites accessing
additional capital
Funding renewables
& downstream transformation
Portfolio activity positive
cash contributor
LEVERAGE | %
Successful in progressive
deleveraging
0.31
0.2
0.13
0.1-0.2
RANGE
I…..
2020
2021
2022
2023-2026
CAPITAL STRUCTURE YE 2022
€ <20 BLN
LONG-TERM DEBT
(70% OF THE TOTAL)
86%
FIXED INTEREST ON LT DEBT
2.2%
AVERAGE COST OF DEBT
100% LT DEBT
SUSTAINABLE-LINKED
SINCE 2021
EBIT
€14 BLN
In 2023
1
CFFO
€16.5 BLN 1
In 2023
>€69 BLN 2
ROACE
~13% 3
Plan average
€47 BLN 2
Over the plan
1 Based on 3Q scenario assumptions.
2 Based on CMD scenario assumptions.
3 Based on CMD constant scenario.
Over the plan
Cash Flows are adjusted pre working capital at replacement cost and exclude effects of derivatives. 2023 Capex updated as per 2Q disclosure.
All figures at plan scenario. Leverage is before IFRS 16.View entire presentation