Ready Capital Investor Presentation Deck
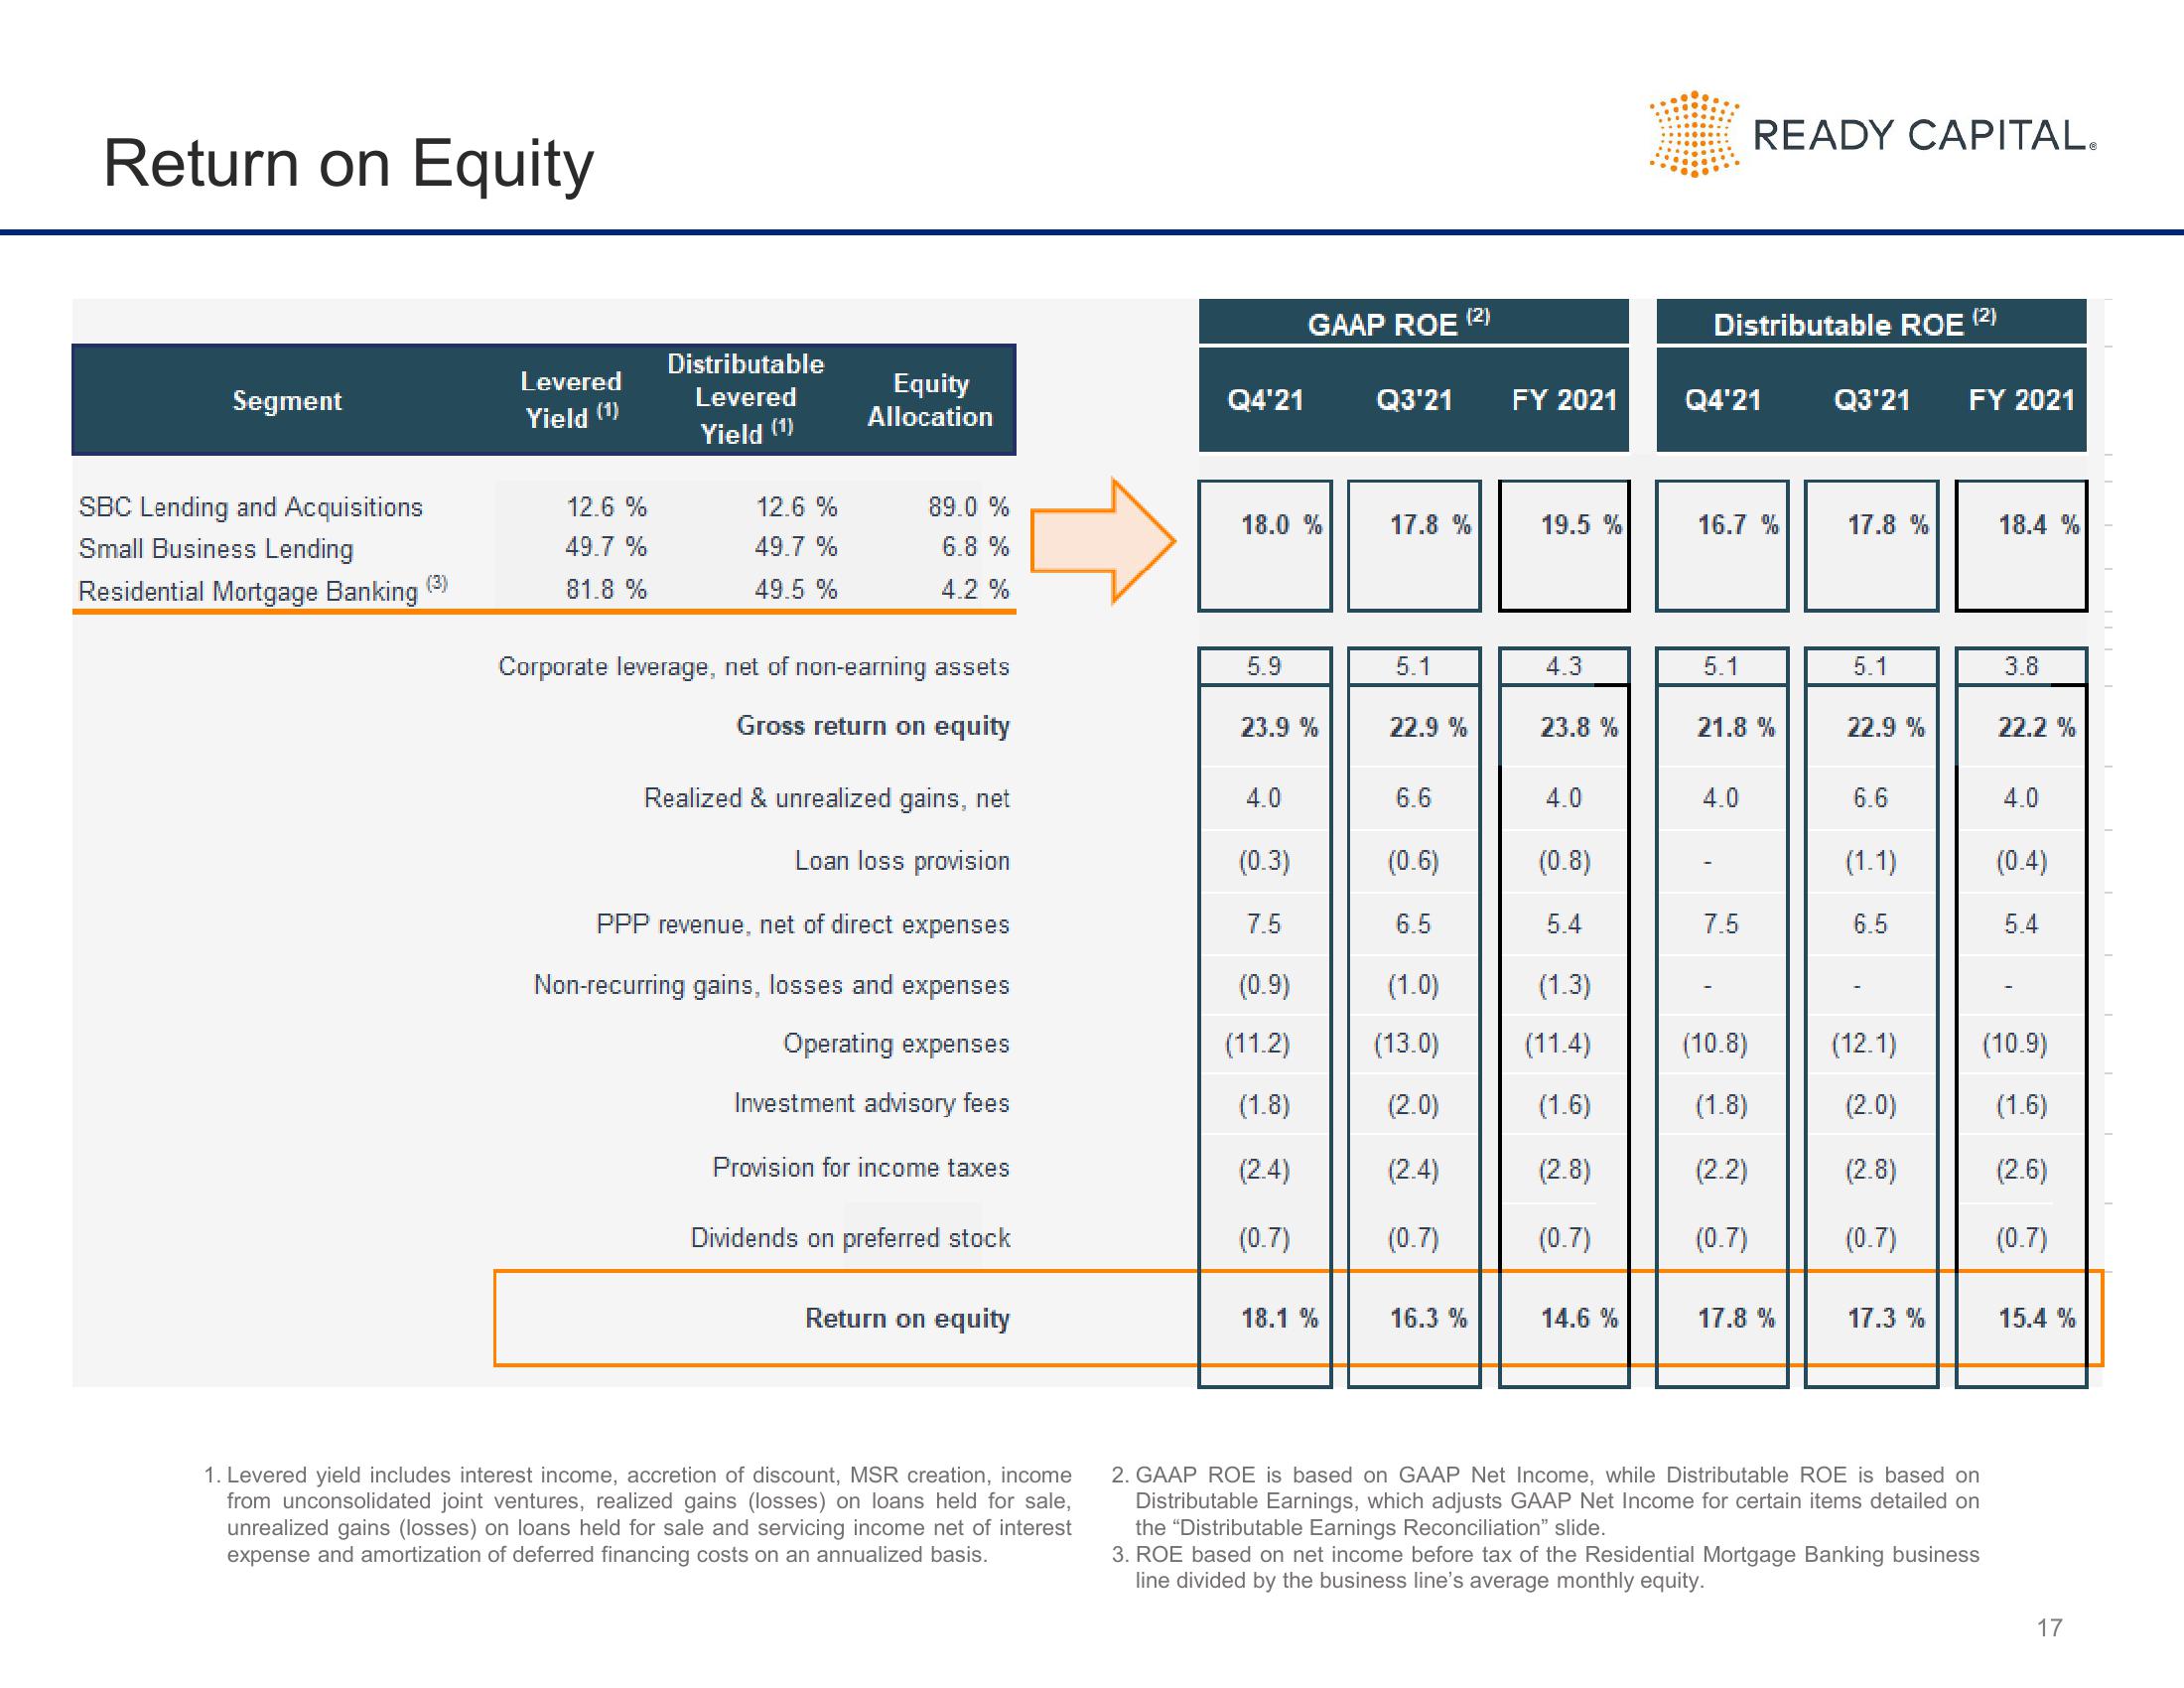
Return on Equity
Segment
SBC Lending and Acquisitions
Small Business Lending
Residential Mortgage Banking (3)
Levered
Yield (1)
12.6 %
49.7 %
81.8 %
Distributable
Levered
Yield (1)
12.6 %
49.7 %
49.5 %
Equity
Allocation
89.0 %
6.8 %
4.2 %
Corporate leverage, net of non-earning assets
Gross return on equity
Realized & unrealized gains, net
Loan loss provision
PPP revenue, net of direct expenses
Non-recurring gains, losses and expenses
Operating expenses
Investment advisory fees
Provision for income taxes
Dividends on preferred stock
Return on equity
1. Levered yield includes interest income, accretion of discount, MSR creation, income
from unconsolidated joint ventures, realized gains (losses) on loans held for sale,
unrealized gains (losses) on loans held for sale and servicing income net of interest
expense and amortization of deferred financing costs on an annualized basis.
Q4'21
18.0 %
5.9
GAAP ROE
23.9 %
4.0
(0.3)
7.5
(0.9)
(11.2)
(1.8)
(2.4)
(0.7)
18.1 %
Q3'21
17.8 %
5.1
(2)
22.9 %
6.6
(0.6)
6.5
(1.0)
(13.0)
(2.0)
(2.4)
(0.7)
16.3 %
FY 2021
19.5 %
4.3
23.8 %
4.0
(0.8)
5.4
(1.3)
(11.4)
(1.6)
(2.8)
(0.7)
14.6 %
Distributable ROE (2)
Q4'21
16.7 %
5.1
READY CAPITAL.
21.8 %
4.0
7.5
(10.8)
(1.8)
(2.2)
(0.7)
17.8 %
Q3'21
17.8 %
5.1
22.9 %
6.6
(1.1)
6.5
(12.1)
(2.0)
(2.8)
(0.7)
17.3 %
FY 2021
2. GAAP ROE is based on GAAP Net Income, while Distributable ROE is based on
Distributable Earnings, which adjusts GAAP Net Income for certain items detailed on
the "Distributable Earnings Reconciliation" slide.
18.4 %
3. ROE based on net income before tax of the Residential Mortgage Banking business
line divided by the business line's average monthly equity.
3.8
22.2 %
4.0
(0.4)
5.4
(10.9)
(1.6)
(2.6)
(0.7)
15.4 %
17View entire presentation