BenevolentAI Investor Conference Presentation Deck
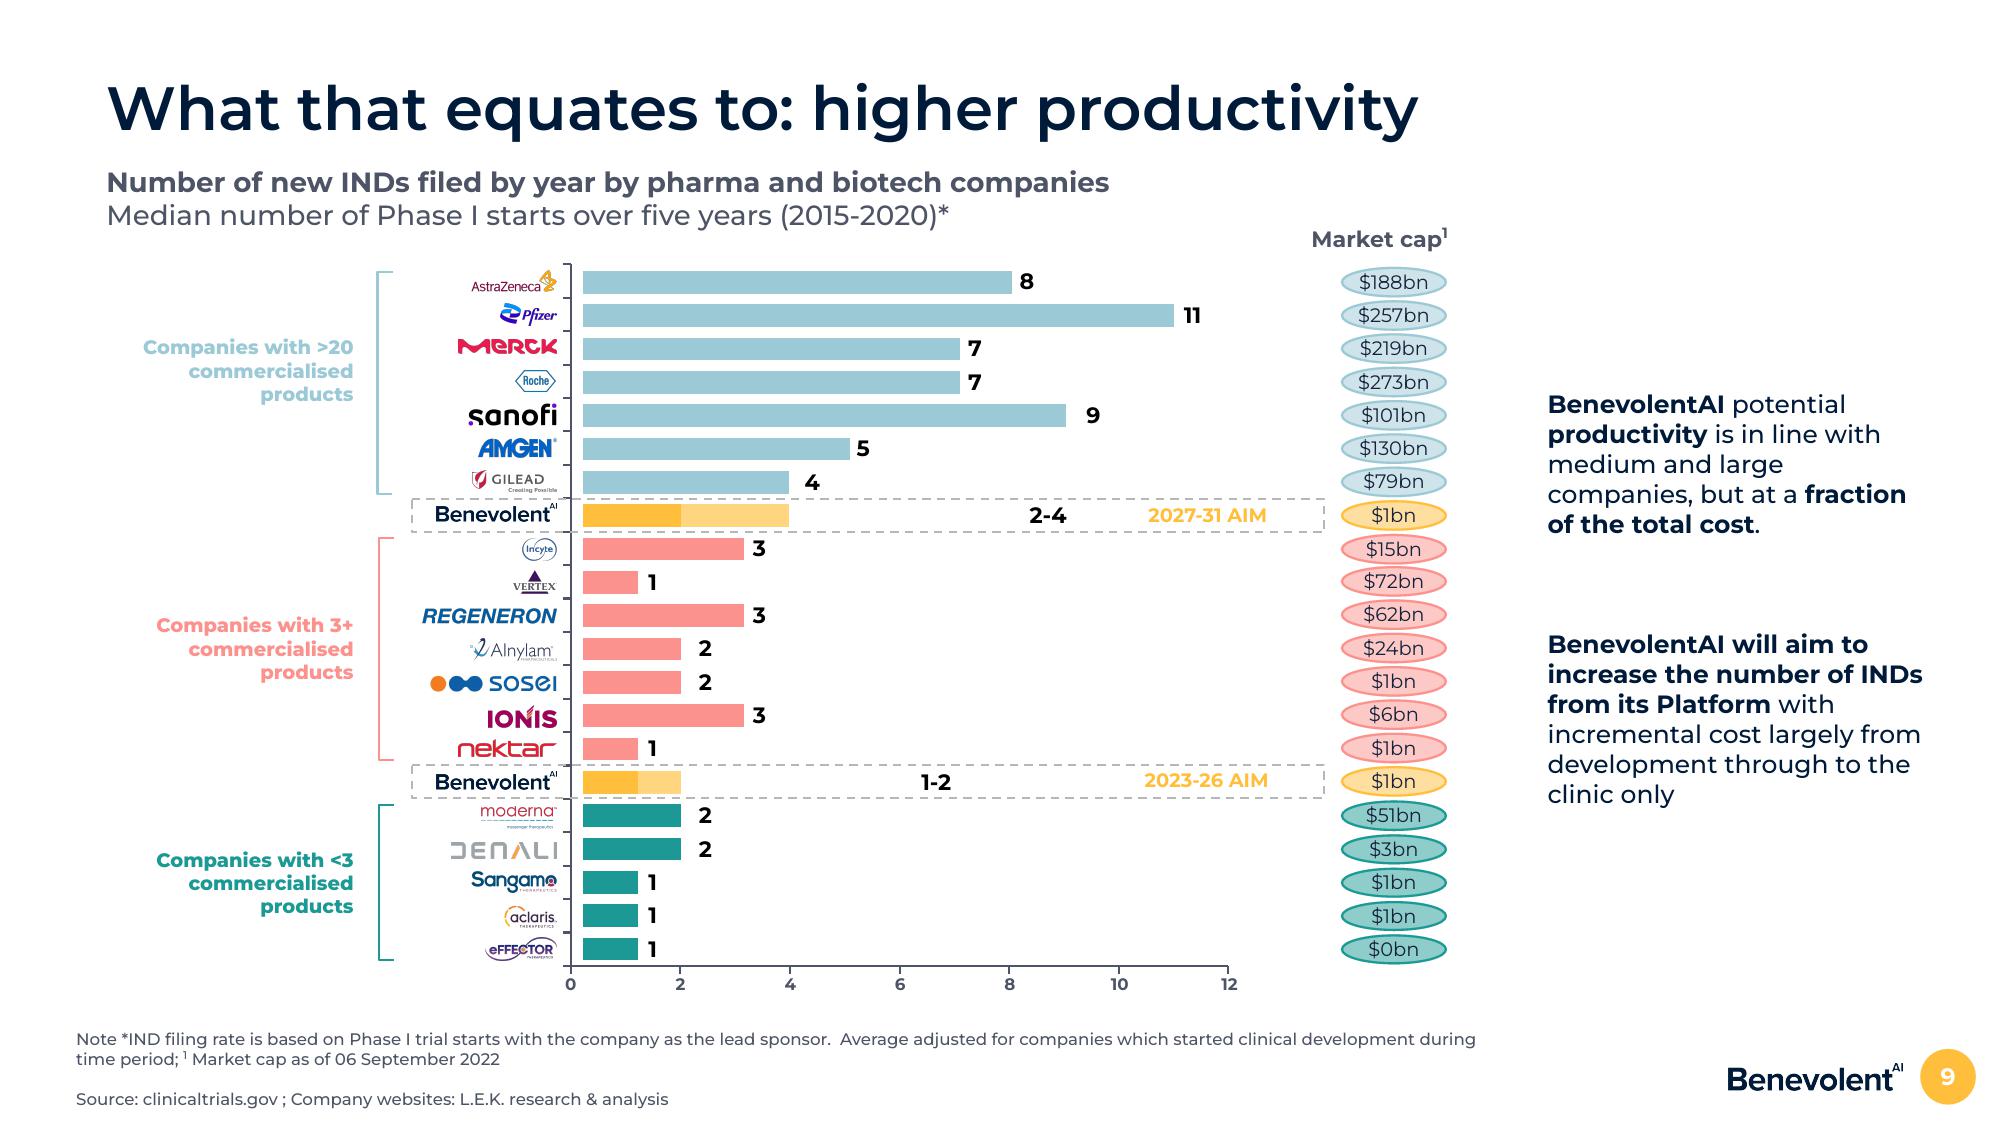
What that equates to: higher productivity
Number of new INDS filed by year by pharma and biotech companies
Median number of Phase I starts over five years (2015-2020)*
Companies with >20
commercialised
products
Companies with 3+
commercialised
products
Companies with <3
commercialised
products
AstraZeneca
Pfizer
Merck
Roche
sanofi
AMGEN
GILEAD
Benevolent
Incyte)
VERTEX
REGENERON
Alnylam
sosel
IONIS
nektar
Benevolent
moderna
DENALI
Sangame
aclaris.
EFFECTOR
0
2
2
2
NN
2
2
3
3
3
4
4
5
1-2
7
7
8
2-4
9
10
11
2027-31 AIM
2023-26 AIM
12
Market cap¹
$188bn
$257bn
$219bn
$273bn
$101bn
$130bn
$79bn
$1bn
$15bn
$72bn
$62bn
$24bn
$1bn
$6bn
$1bn
$1bn
$51bn
$3bn
$1bn
$1bn
$0bn
Note *IND filing rate is based on Phase I trial starts with the company as the lead sponsor. Average adjusted for companies which started clinical development during
time period; ¹ Market cap as of 06 September 2022
Source: clinical trials.gov; Company websites: L.E.K. research & analysis
BenevolentAl potential
productivity is in line with
medium and large
companies, but at a fraction
of the total cost.
BenevolentAl will aim to
increase the number of INDS
from its Platform with
incremental cost largely from
development through to the
clinic only
Benevolent
9View entire presentation