eToro Results Presentation Deck
P23
бетого
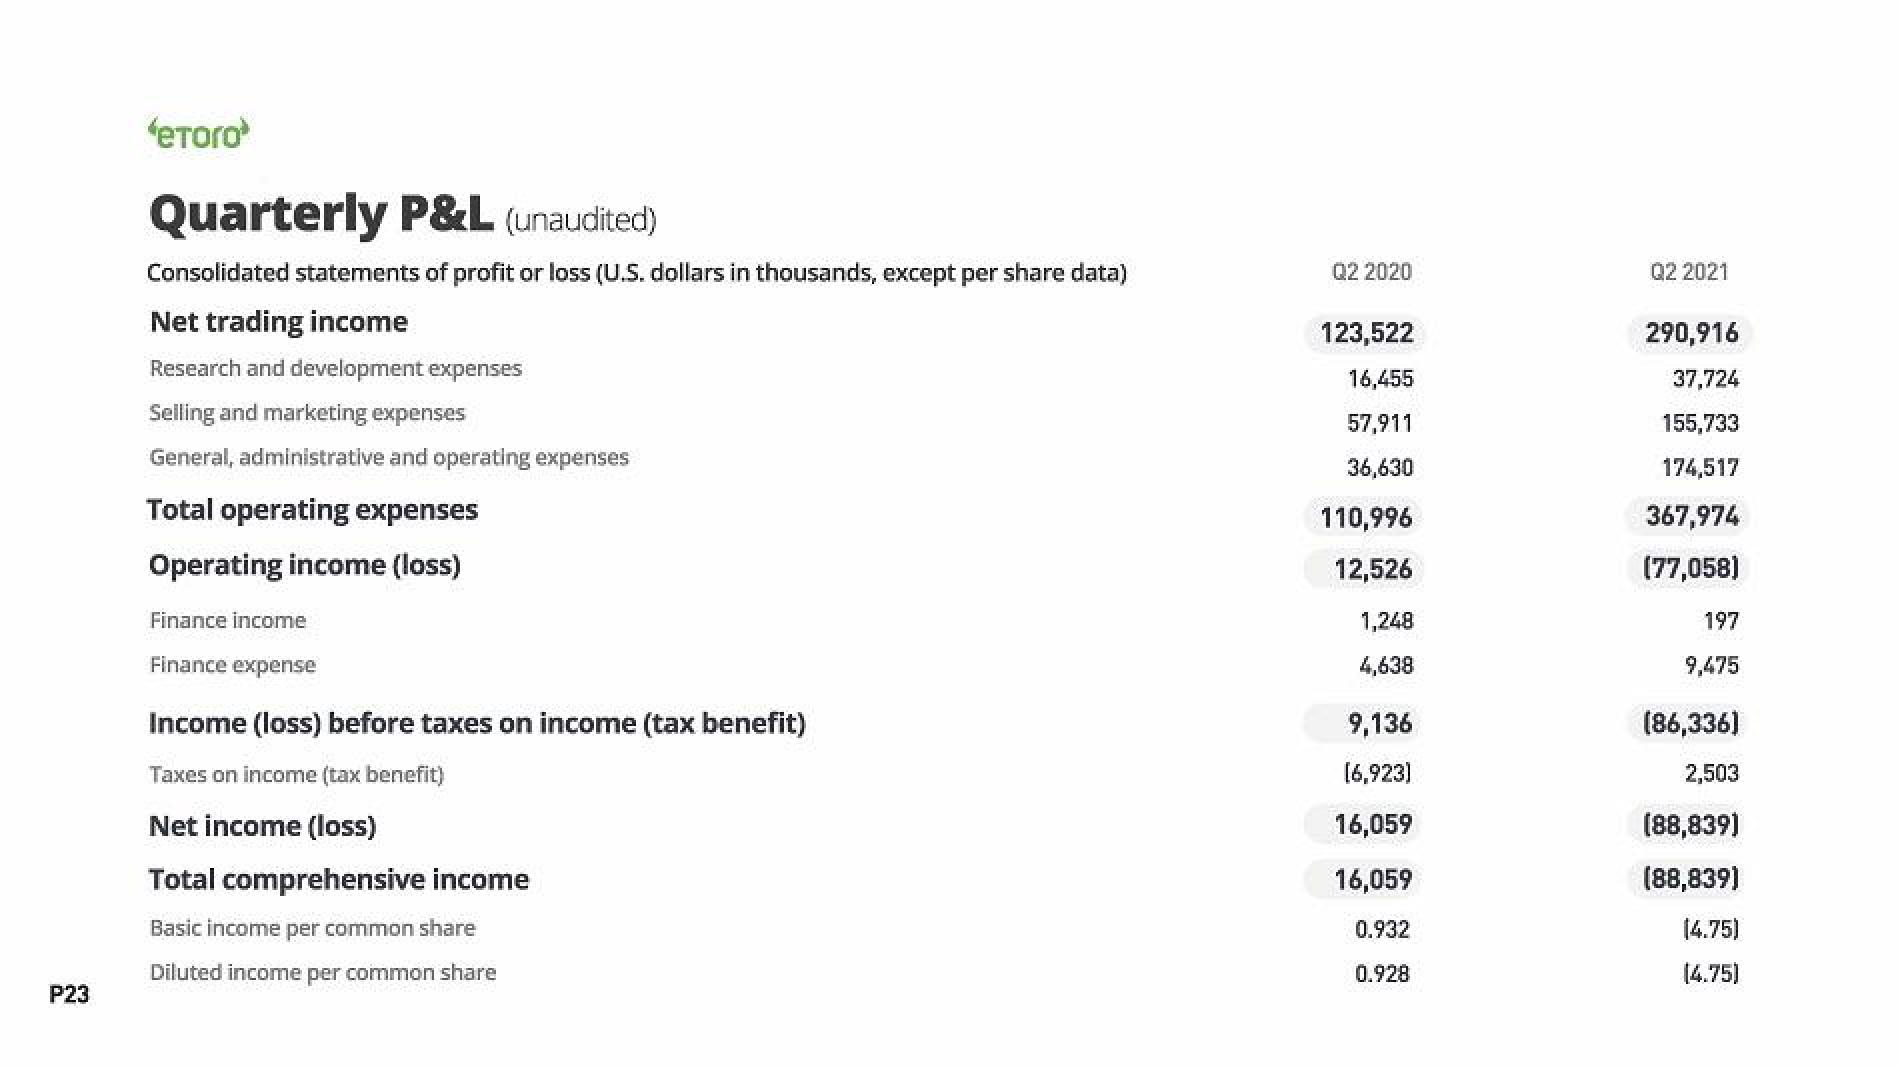
Quarterly P&L (unaudited)
Consolidated statements of profit or loss (U.S. dollars in thousands, except per share data)
Net trading income
Research and development expenses
Selling and marketing expenses
General, administrative and operating expenses
Total operating expenses
Operating income (loss)
Finance income
Finance expense
Income (loss) before taxes on income (tax benefit)
Taxes on income (tax benefit)
Net income (loss)
Total comprehensive income
Basic income per common share
Diluted income per common share
Q2 2020
123,522
16,455
57,911
36,630
110,996
12,526
1,248
4,638
9,136
[6,923]
16,059
16,059
0.932
0.928
Q2 2021
290,916
37,724
155,733
174,517
367,974
(77,058)
197
9,475
(86,336)
2,503
(88,839)
(88,839)
(4.75)
(4.75)View entire presentation