Snap Inc Investor Presentation Deck
Snap Inc.
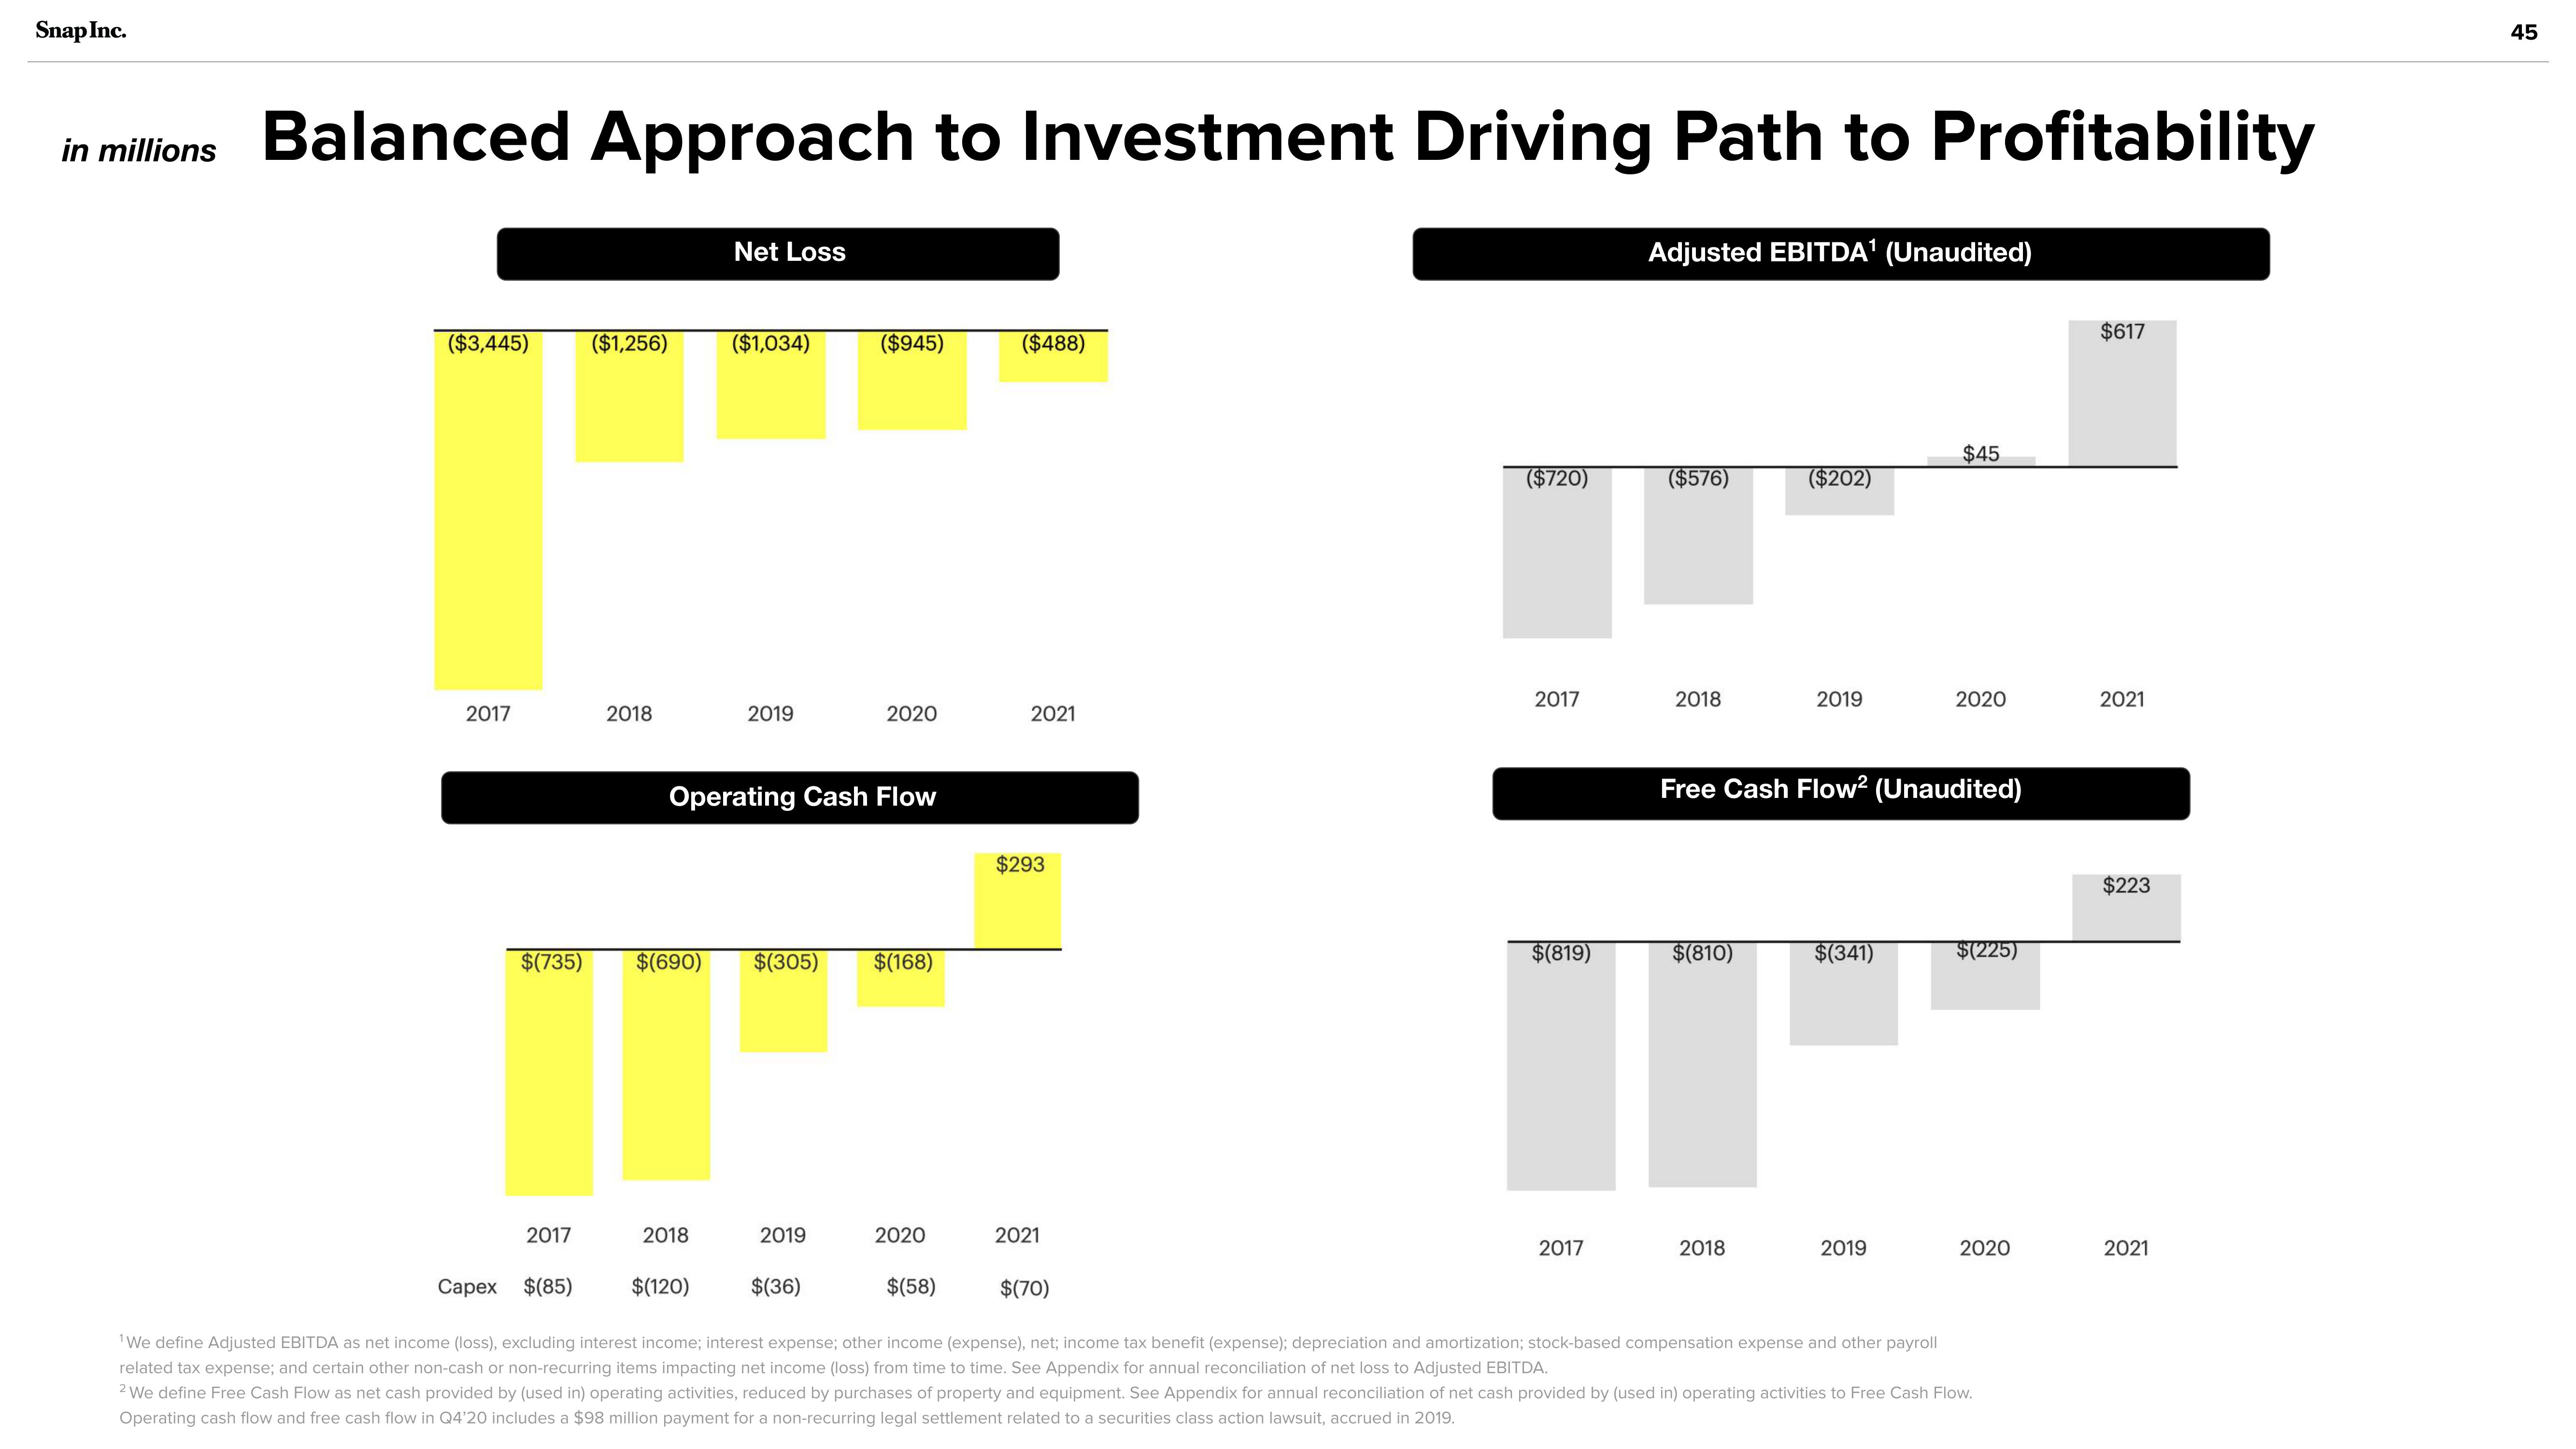
in millions Balanced Approach to Investment Driving Path to Profitability
($3,445)
2017
$(735)
2017
Capex $(85)
($1,256)
2018
$(690)
2018
Net Loss
$(120)
($1,034)
2019
Operating Cash Flow
$(305)
2019
($945)
$(36)
2020
$(168)
2020
$(58)
($488)
2021
$293
2021
$(70)
($720)
2017
$(819)
2017
Adjusted EBITDA¹ (Unaudited)
($576)
2018
$(810)
($202)
2018
2019
Free Cash Flow² (Unaudited)
$(341)
$45
2019
2020
$(225)
2020
¹We define Adjusted EBITDA as net income (loss), excluding interest income; interest expense; other income (expense), net; income tax benefit (expense); depreciation and amortization; stock-based compensation expense and other payroll
related tax expense; and certain other non-cash or non-recurring items impacting net income (loss) from time to time. See Appendix for annual reconciliation of net loss to Adjusted EBITDA.
2 We define Free Cash Flow as net cash provided by (used in) operating activities, reduced by purchases of property and equipment. See Appendix for annual reconciliation of net cash provided by (used in) operating activities to Free Cash Flow.
Operating cash flow and free cash flow in Q4'20 includes a $98 million payment for a non-recurring legal settlement related to a securities class action lawsuit, accrued in 2019.
$617
2021
$223
2021
45View entire presentation