Pershing Square Activist Presentation Deck
A. Pershing's Proposal: Assumptions
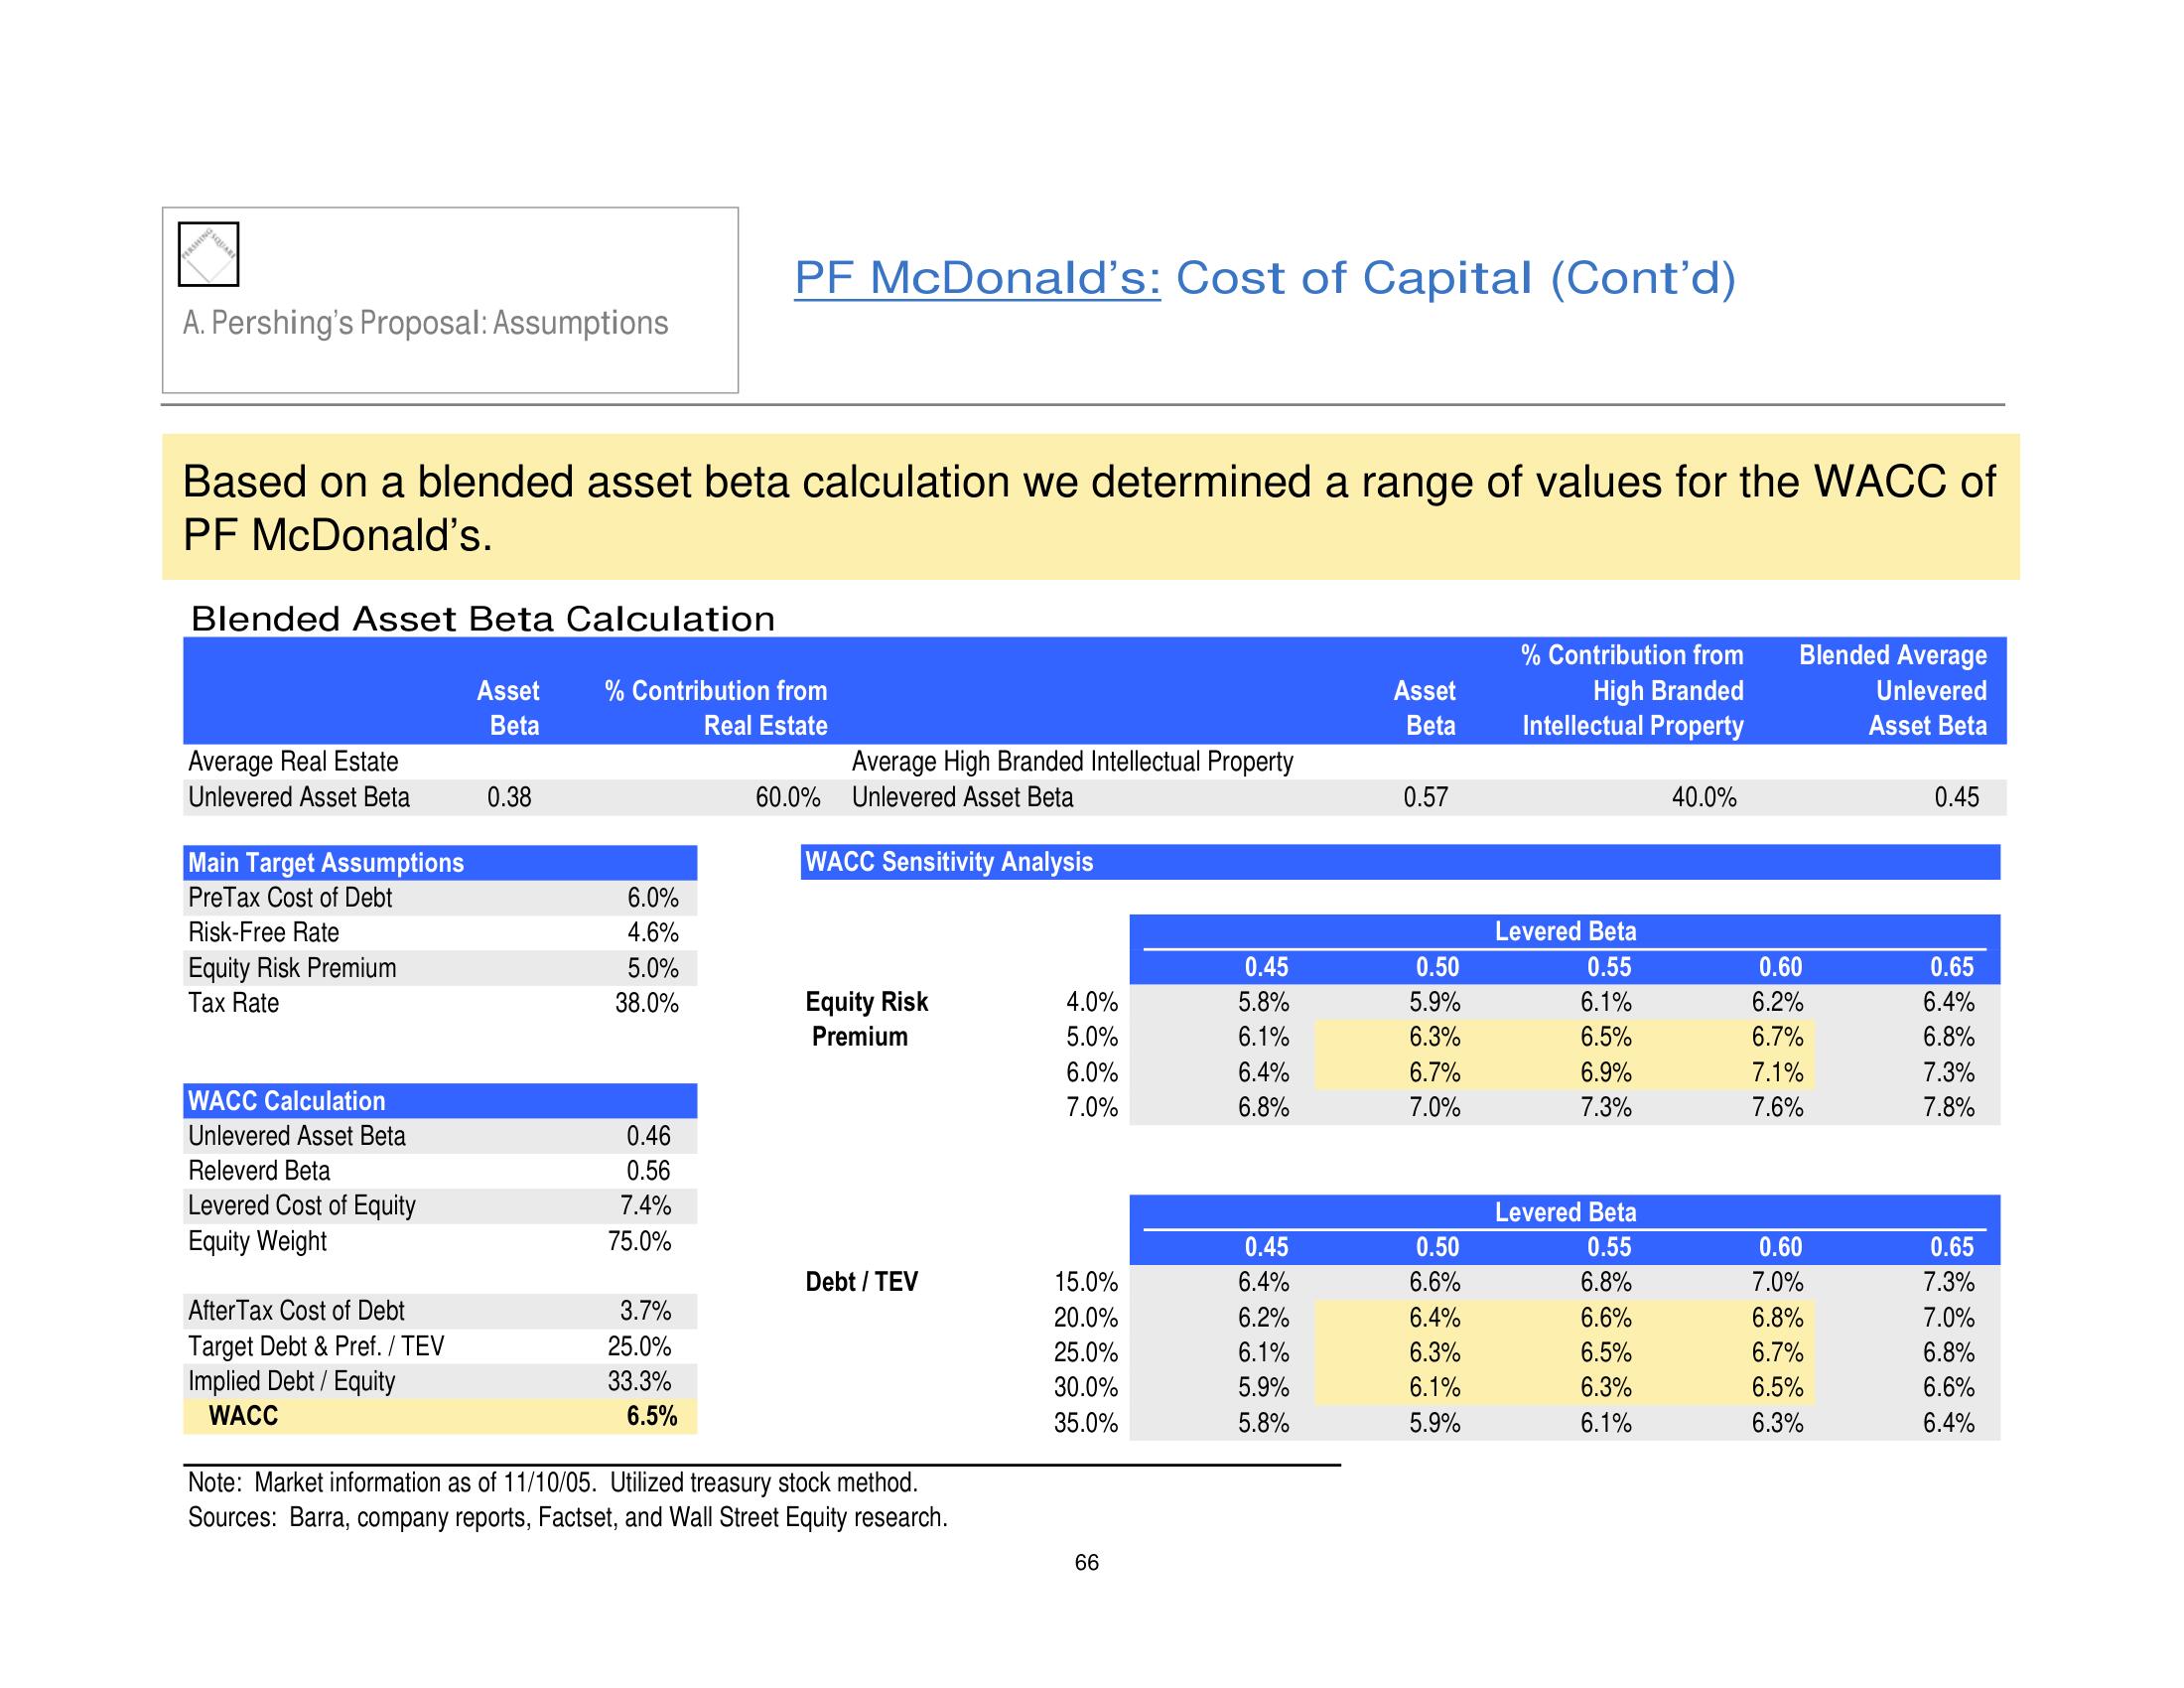
Based on a blended asset beta calculation we determined a range of values for the WACC of
PF McDonald's.
Blended Asset Beta Calculation
Asset
Beta
Average Real Estate
Unlevered Asset Beta
Main Target Assumptions
PreTax Cost of Debt
Risk-Free Rate
Equity Risk Premium
Tax Rate
WACC Calculation
Unlevered Asset Beta
Releverd Beta
Levered Cost of Equity
Equity Weight
After Tax Cost of Debt
Target Debt & Pref. / TEV
Implied Debt / Equity
WACC
0.38
% Contribution from
Real Estate
6.0%
4.6%
5.0%
38.0%
0.46
0.56
7.4%
75.0%
PF McDonald's: Cost of Capital (Cont'd)
3.7%
25.0%
33.3%
6.5%
Average High Branded Intellectual Property
60.0% Unlevered Asset Beta
WACC Sensitivity Analysis
Equity Risk
Premium
Debt / TEV
Note: Market information as of 11/10/05. Utilized treasury stock method.
Sources: Barra, company reports, Factset, and Wall Street Equity research.
4.0%
5.0%
6.0%
7.0%
15.0%
20.0%
25.0%
30.0%
35.0%
66
0.45
5.8%
6.1%
6.4%
6.8%
0.45
6.4%
6.2%
6.1%
5.9%
5.8%
Asset
Beta
0.57
0.50
5.9%
6.3%
6.7%
7.0%
0.50
6.6%
6.4%
6.3%
6.1%
5.9%
% Contribution from
High Branded
Intellectual Property
Levered Beta
0.55
6.1%
6.5%
6.9%
7.3%
Levered Beta
0.55
6.8%
6.6%
6.5%
6.3%
6.1%
40.0%
Blended Average
Unlevered
Asset Beta
0.60
6.2%
6.7%
7.1%
7.6%
0.60
7.0%
6.8%
6.7%
6.5%
6.3%
0.45
0.65
6.4%
6.8%
7.3%
7.8%
0.65
7.3%
7.0%
6.8%
6.6%
6.4%View entire presentation