3Q20 Earnings Call Presentation
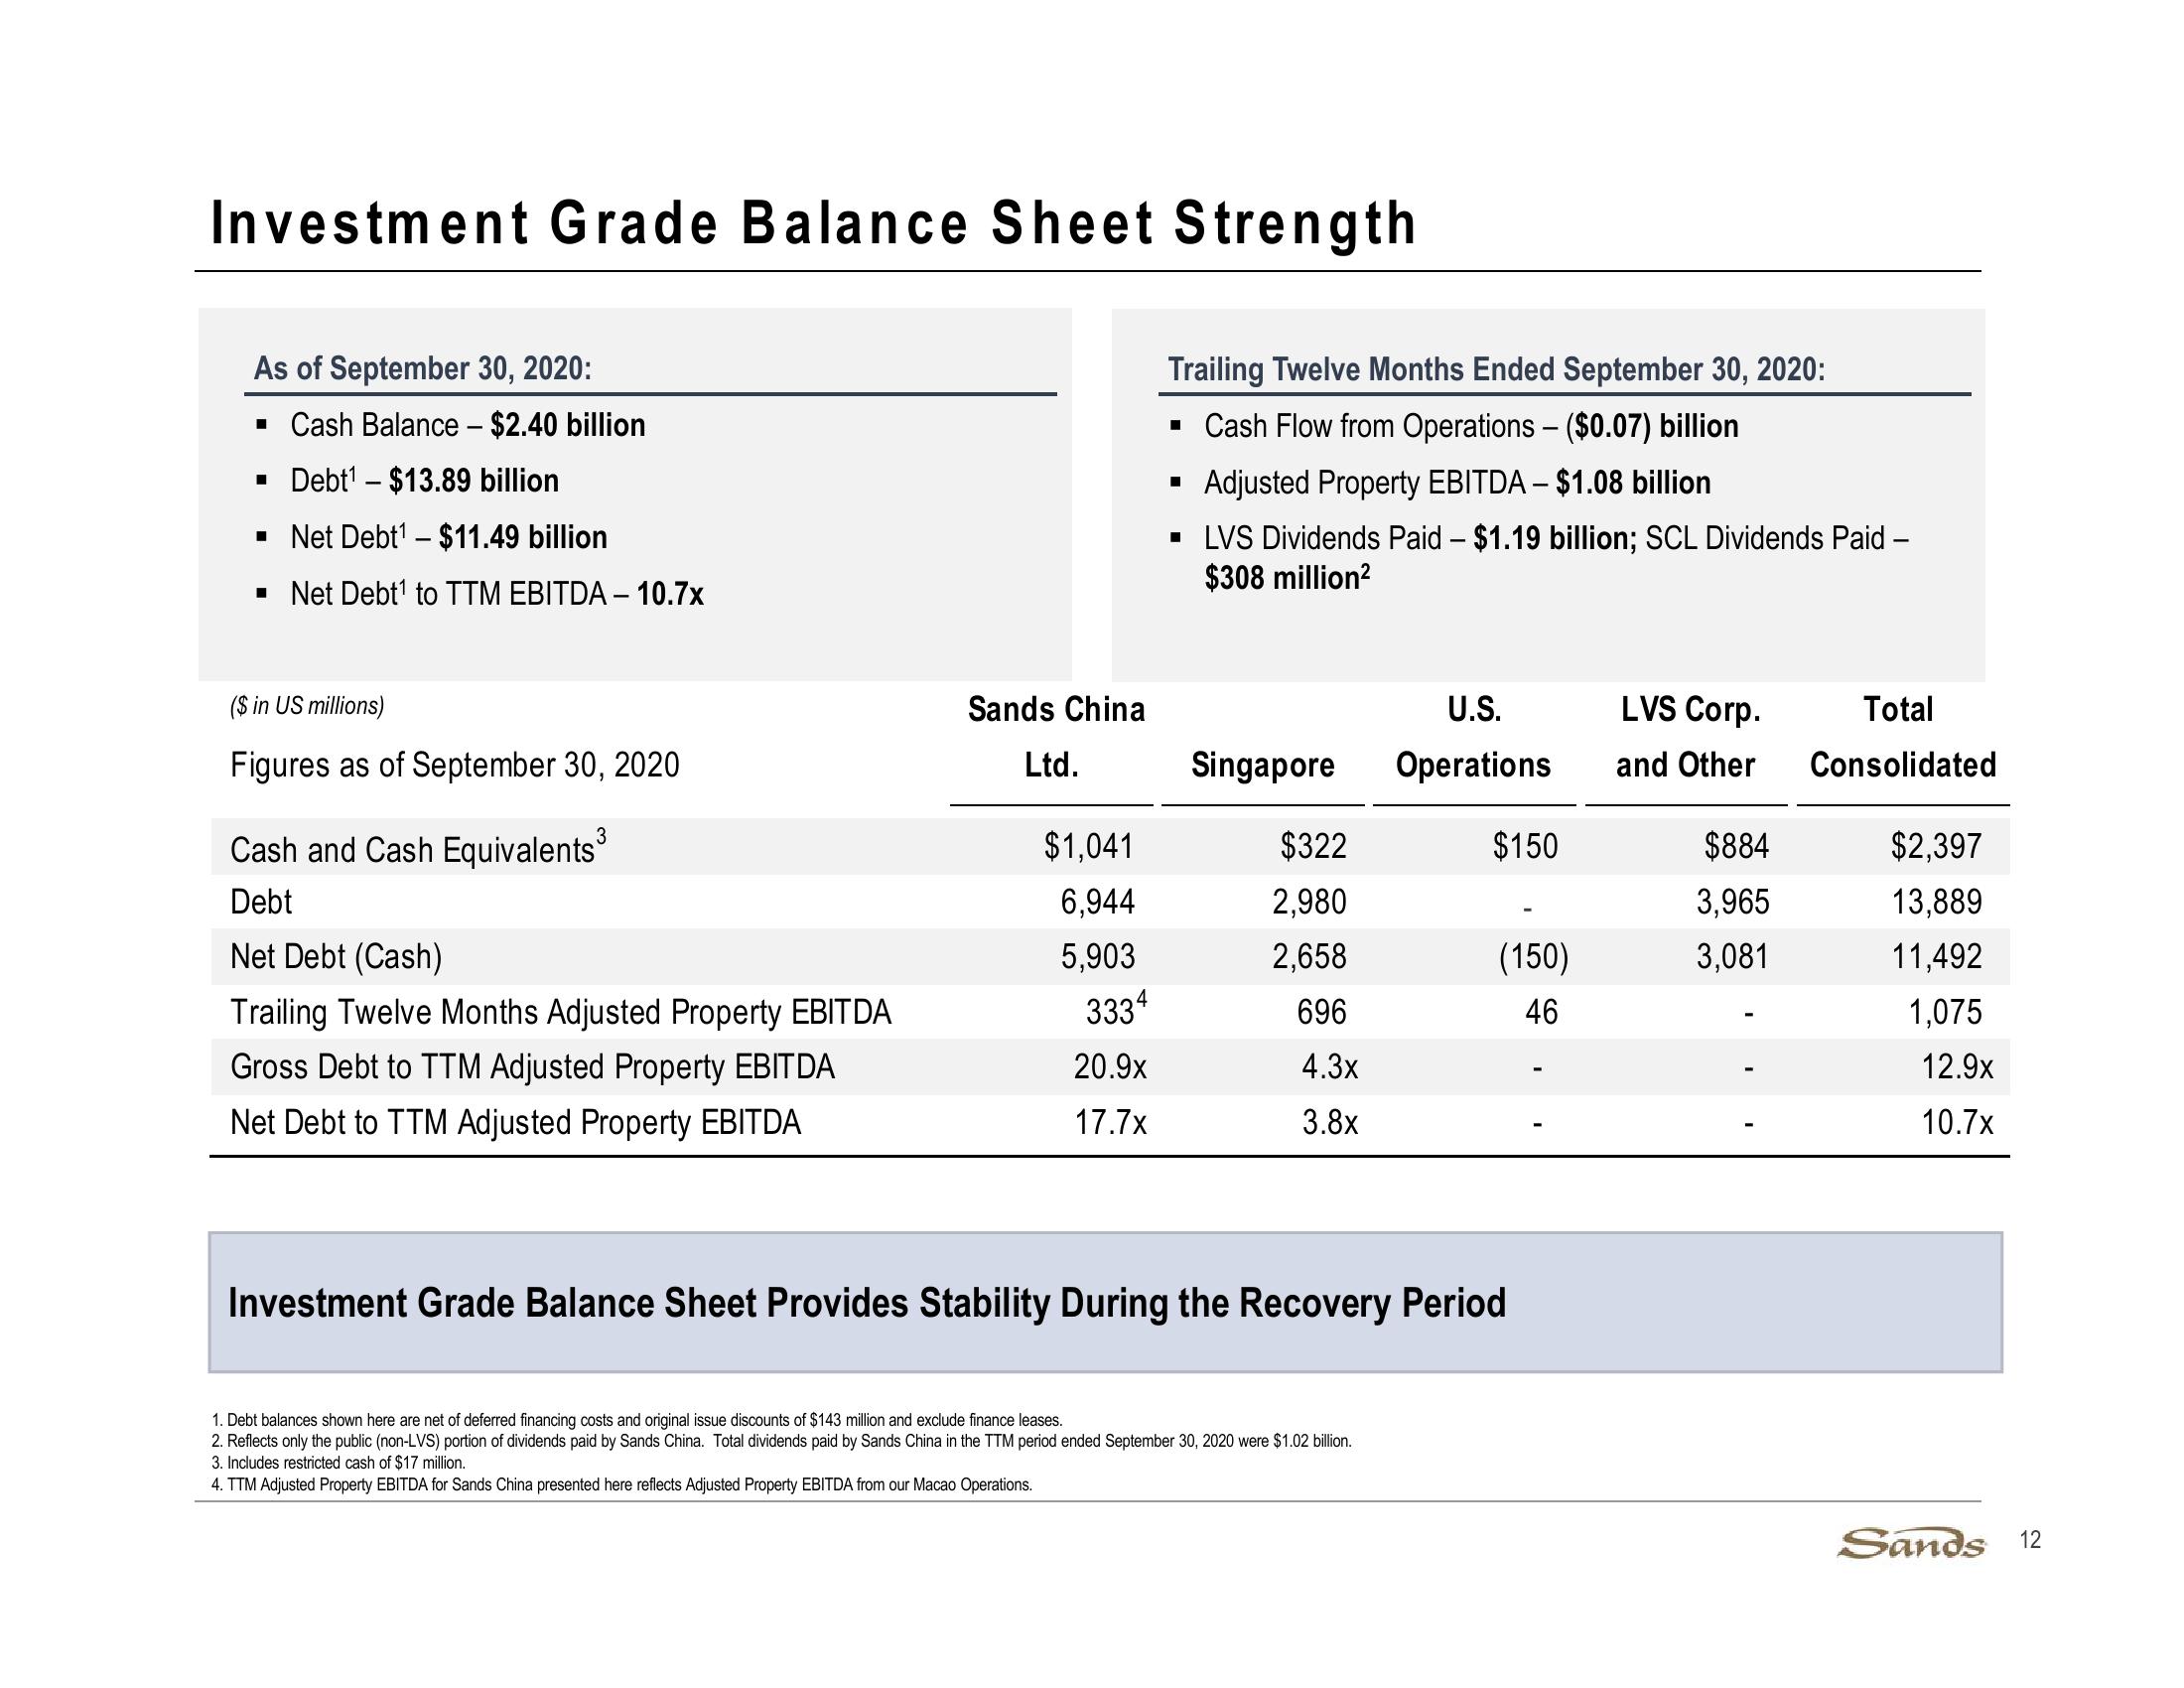
Investment Grade Balance Sheet Strength
As of September 30, 2020:
■ Cash Balance - $2.40 billion
■ Debt¹ - $13.89 billion
■ Net Debt¹ - $11.49 billion
■ Net Debt¹ to TTM EBITDA - 10.7x
Trailing Twelve Months Ended September 30, 2020:
■ Cash Flow from Operations – ($0.07) billion
◉
Adjusted Property EBITDA - $1.08 billion
■ LVS Dividends Paid - $1.19 billion; SCL Dividends Paid -
$308 million²
($ in US millions)
Sands China
U.S.
LVS Corp.
Total
Figures as of September 30, 2020
Ltd.
Singapore
Operations
and Other
Consolidated
Cash and Cash Equivalents³
$1,041
$322
$150
$884
$2,397
Debt
6,944
2,980
3,965
13,889
Net Debt (Cash)
5,903
2,658
(150)
3,081
11,492
Trailing Twelve Months Adjusted Property EBITDA
3334
696
46
1,075
Gross Debt to TTM Adjusted Property EBITDA
20.9x
4.3x
12.9x
Net Debt to TTM Adjusted Property EBITDA
17.7x
3.8x
10.7x
Investment Grade Balance Sheet Provides Stability During the Recovery Period
1. Debt balances shown here are net of deferred financing costs and original issue discounts of $143 million and exclude finance leases.
2. Reflects only the public (non-LVS) portion of dividends paid by Sands China. Total dividends paid by Sands China in the TTM period ended September 30, 2020 were $1.02 billion.
3. Includes restricted cash of $17 million.
4. TTM Adjusted Property EBITDA for Sands China presented here reflects Adjusted Property EBITDA from our Macao Operations.
Sands 12View entire presentation