Baird Investment Banking Pitch Book
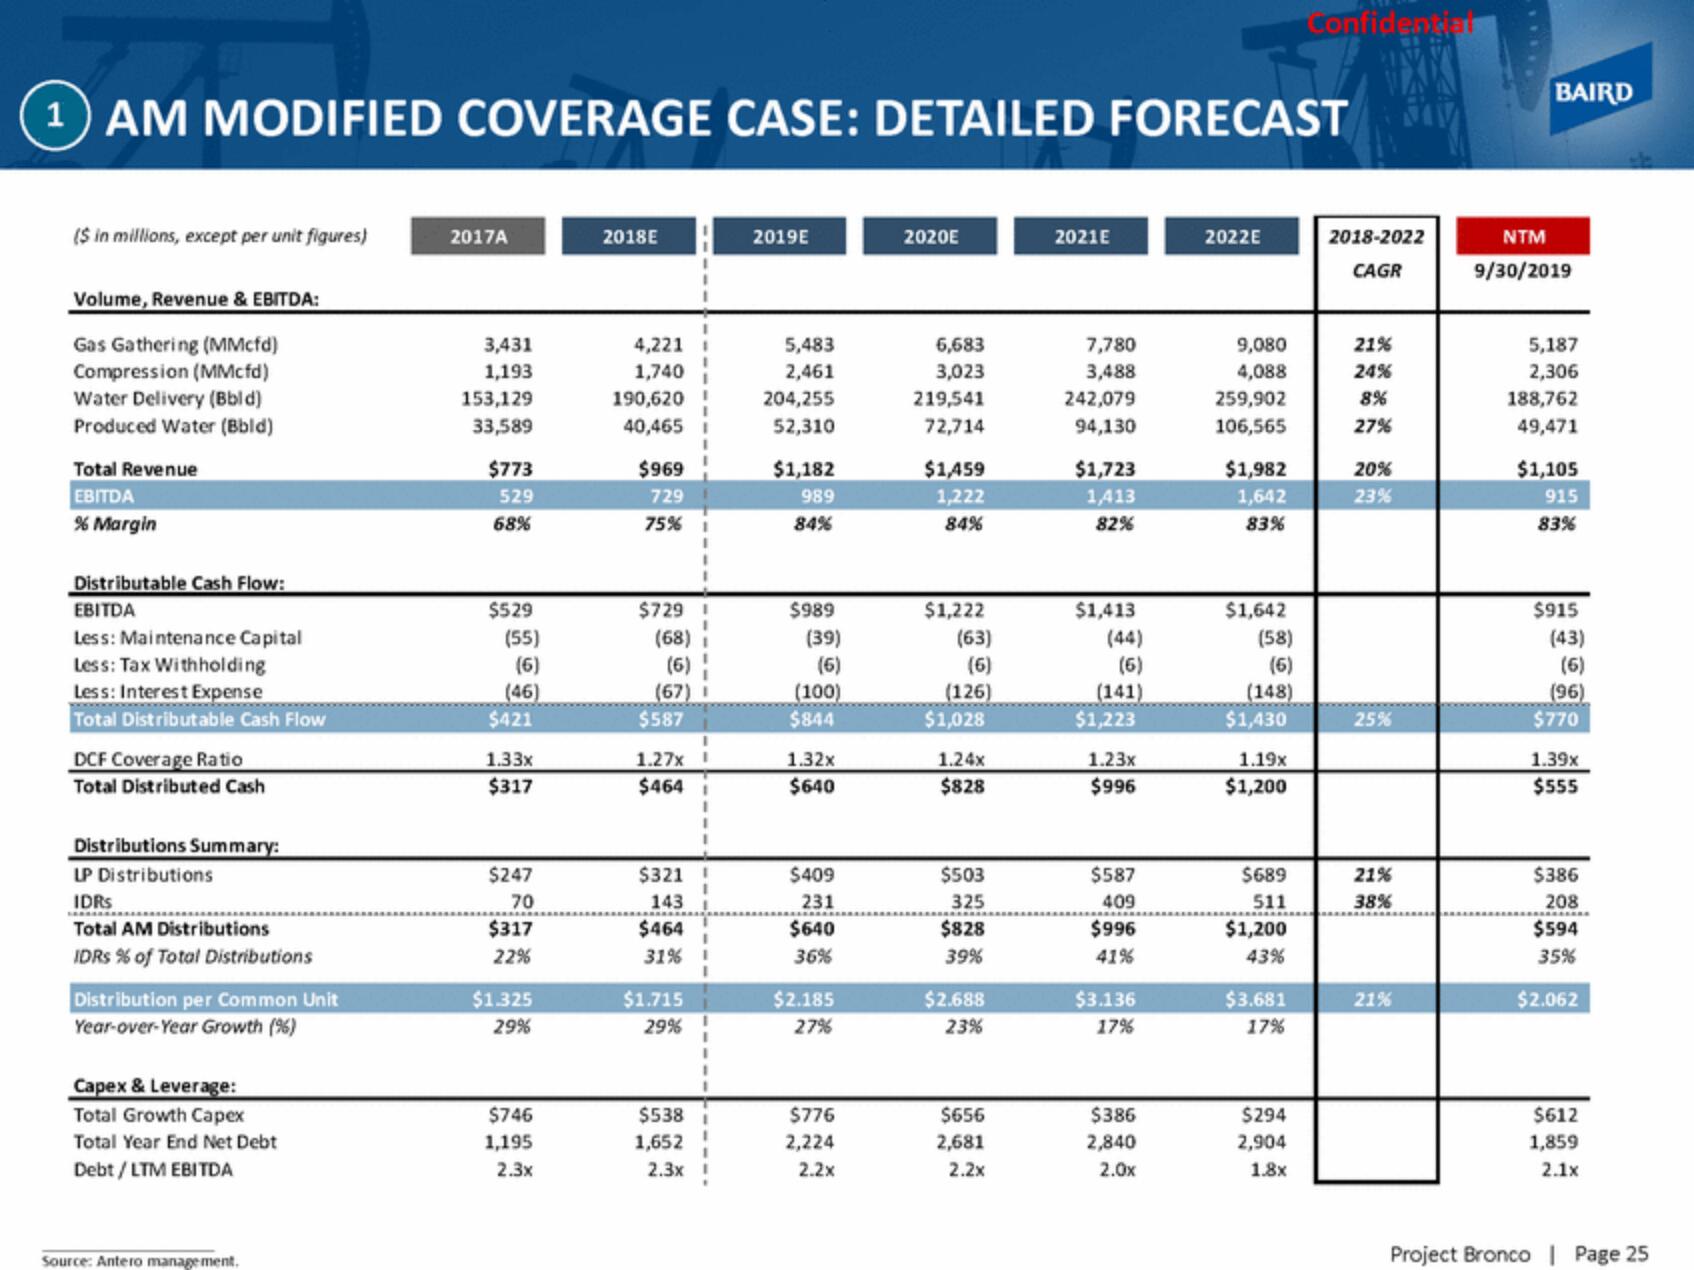
1 AM MODIFIED COVERAGE CASE: DETAILED FORECAST
($ in millions, except per unit figures)
Volume, Revenue & EBITDA:
Gas Gathering (MMcfd)
Compression (MMcfd)
Water Delivery (Bbld)
Produced Water (Bbld)
Total Revenue
EBITDA
% Margin
Distributable Cash Flow:
EBITDA
Less: Maintenance Capital
Less: Tax Withholding
Less: Interest Expense
Total Distributable Cash Flow
DCF Coverage Ratio
Total Distributed Cash
Distributions Summary:
LP Distributions
IDRS
*******
Total AM Distributions
IDRS % of Total Distributions
Distribution per Common Unit
Year-over-Year Growth (%)
Capex & Leverage:
Total Growth Capex
Total Year End Net Debt
Debt/LTM EBITDA
Source: Antero management.
2017A
3,431
1,193
153,129
33,589
$773
529
68%
$529
(55)
(6)
(46)
$421
1.33x
$317
$247
70
$317
22%
$1.325
29%
$746
1,195
2.3x
2018E
4,221
1,740
190,620
40,465
$969
729
75%
$729 1
(68)
(6)
(67)
$587
1.27x
$464
$32
143
$464
31%
$1.715
29%
$538
1,652
2.3x
I
2019E
5,483
2,461
204,255
52,310
$1,182
989
84%
$989
(39)
(6)
(100)
$844
1.32x
$640
$409
231
$640
36%
$2.185
27%
$776
2,224
2.2x
2020E
6,683
3,023
219,541
72,714
$1,459
1,222
84%
$1,222
(63)
(6)
(126)
$1,028
1.24x
$828
325
$828
39%
$2.688
23%
$656
2,681
2.2x
2021E
7,780
3,488
242,079
94,130
$1,723
1,413
82%
$1,413
(6)
(141)
$1,223
1.23x
$996
$587
409
$996
41%
$3.136
17%
$386
2,840
2.0x
2022E
9,080
4,088
259,902
106,565
$1,982
1,642
83%
$1,642
(58)
(6)
(148)
$1,430
1.19x
$1,200
511
$1,200
43%
$3.681
17%
Confidential
$294
2,904
1.8x
2018-2022
CAGR
21%
24%
8%
27%
20%
23%
25%
38%
21%
BAIRD
NTM
9/30/2019
5,187
2,306
188,762
49,471
$1,105
915
83%
$915
(43)
(6)
(96)
$770
1.39x
$555
$386
208
$594
35%
$2.062
$612
1,859
2.1x
Project Bronco | Page 25View entire presentation