Enfusion Results Presentation Deck
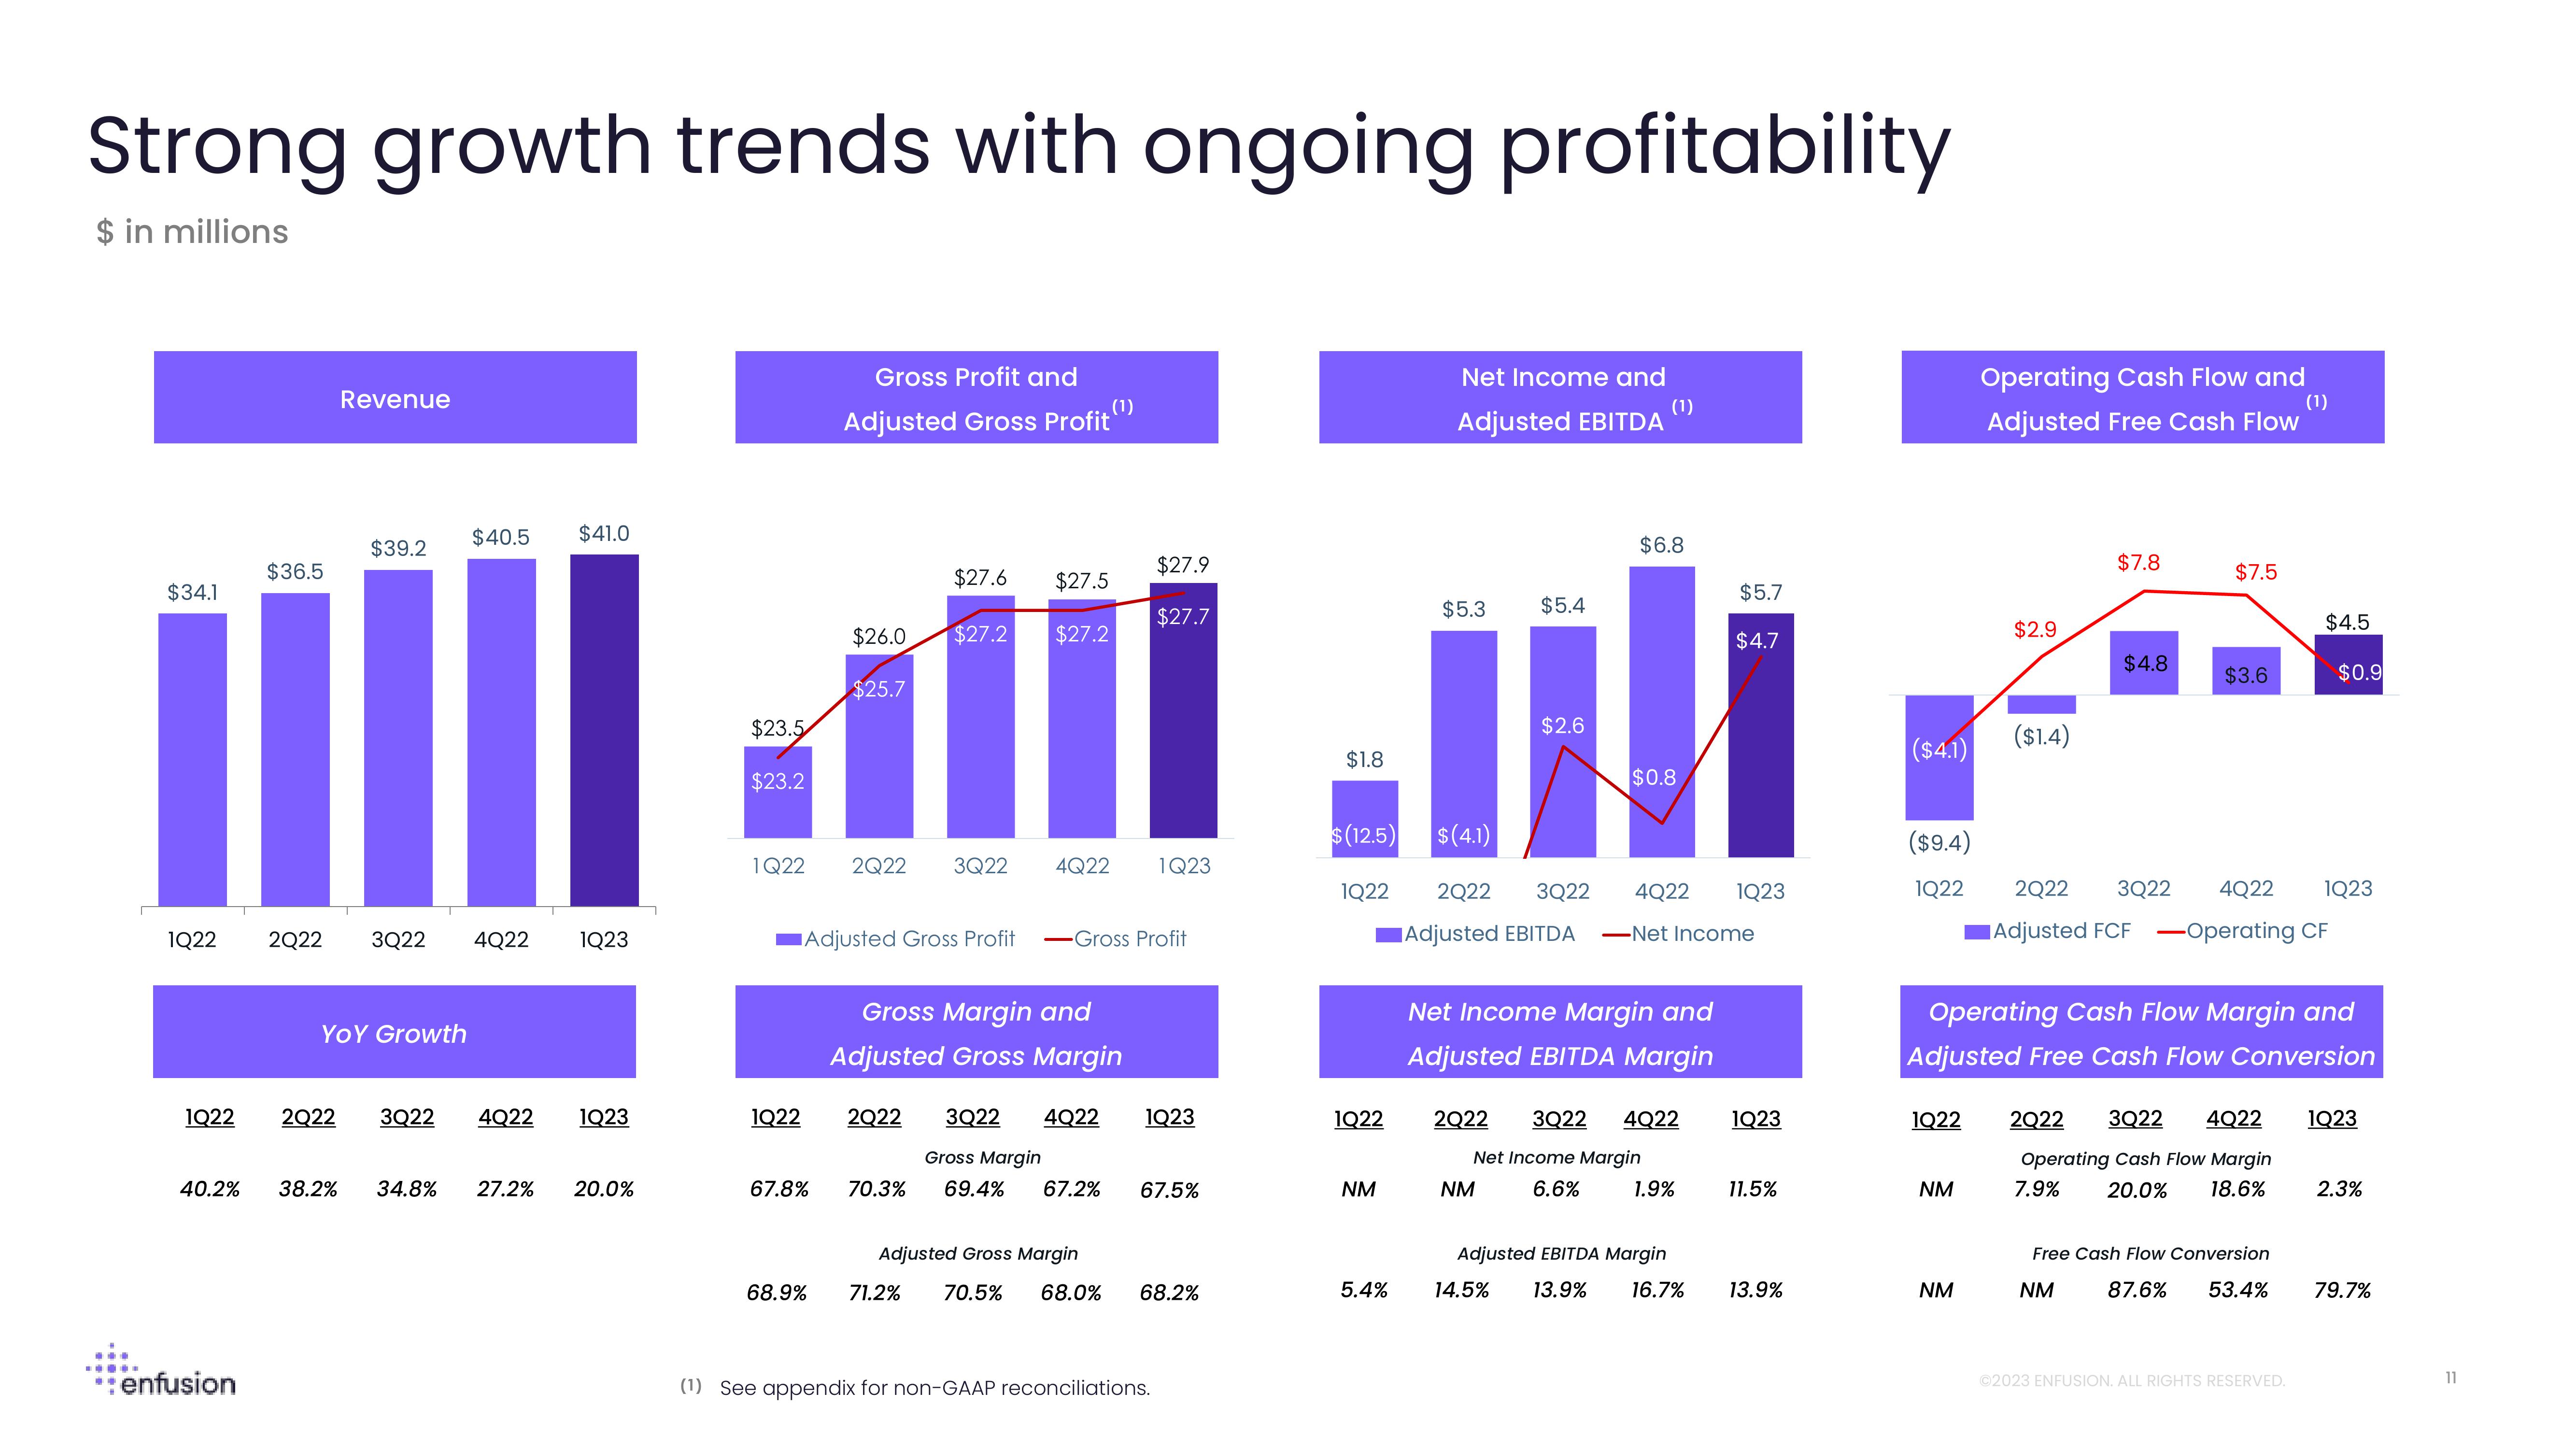
Strong growth trends with ongoing profitability
$ in millions
$34.1
1Q22
1Q22
40.2%
*:enfusion
$36.5
Revenue
$39.2
$40.5 $41.0
2Q22 3Q22 4Q22 1Q23
YOY Growth
2Q22 3Q22 4Q22 1Q23
38.2% 34.8% 27.2% 20.0%
$23.5
$23.2
1Q22
Gross Profit and
Adjusted Gross Profit
(1)
1Q22
$27.6
$26.0 $27.2
$25.7
2Q22 3Q22
Adjusted Gross Profit
$27.5
$27.2
2Q22
4Q22 1Q23
Gross Margin and
Adjusted Gross Margin
3Q22 4Q22
Gross Margin
67.8% 70.3% 69.4% 67.2%
-Gross Profit
$27.9
$27.7
Adjusted Gross Margin
68.9% 71.2% 70.5% 68.0%
1Q23
67.5%
68.2%
(1) See appendix for non-GAAP reconciliations.
$1.8
$(12.5)
1Q22
1Q22
NM
Net Income and
Adjusted EBITDA
$5.3
$5.4
$2.6
(1)
$6.8
$0.8
$(4.1)
2Q22 3Q22 4Q22 1Q23
Adjusted EBITDA -Net Income
Net Income Margin and
Adjusted EBITDA Margin
2Q22 3Q22 4Q22
Net Income Margin
6.6%
NM
1.9%
$5.7
$4.7
Adjusted EBITDA Margin
5.4% 14.5% 13.9% 16.7%
1Q23
11.5%
13.9%
($4.1)
1Q22
Operating Cash Flow and
(1)
Adjusted Free Cash Flow
($9.4)
1Q22 2Q22
NM
$2.9
NM
($1.4)
$7.8
$4.8
$7.5
$3.6
Operating Cash Flow Margin and
Adjusted Free Cash Flow Conversion
$4.5
3Q22 4Q22 1Q23
Adjusted FCF -Operating CF
$0.9
Free Cash Flow Conversion
NM
87.6% 53.4%
2Q22 3Q22 4Q22 1Q23
Operating Cash Flow Margin
7.9%
20.0% 18.6%
Ⓒ2023 ENFUSION. ALL RIGHTS RESERVED.
2.3%
79.7%
11View entire presentation