Kering Investor Presentation Deck
Air
pollution
8%
Greenhouse gas
emissions
38%
Land use
31% apod
Waste
production
4%
713321
Water
consumption
4%
Water
pollution
15%
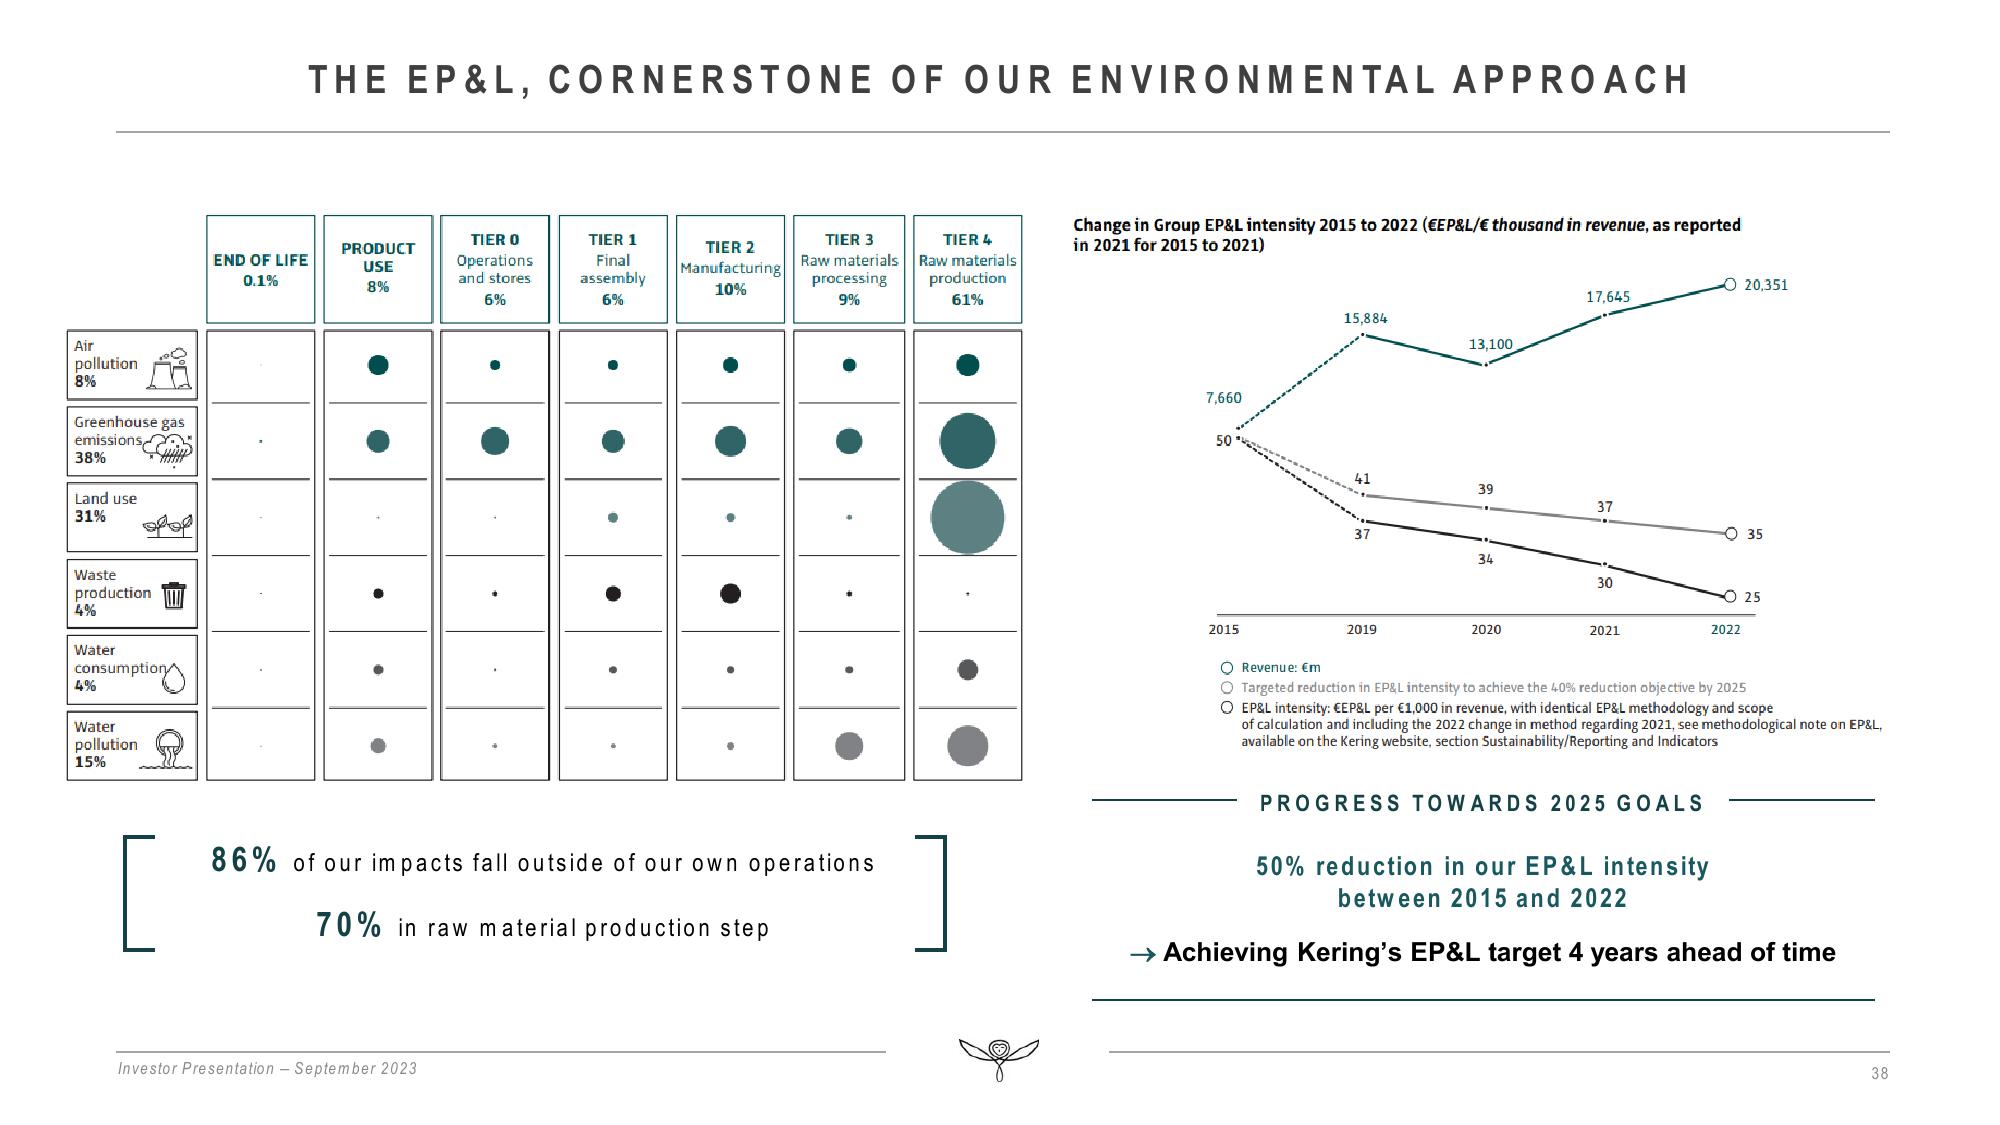
THE EP&L, CORNERSTONE OF OUR ENVIRONMENTAL APPROACH
END OF LIFE
0.1%
PRODUCT
USE
8%
TIER O
Operations
and stores
6%
Investor Presentation - September 2023
•
TIER 1
Final
assembly
6%
TIER 2
Manufacturing
10%
TIER 3
Raw materials
processing
9%
86% of our impacts fall outside of our own operations
70% in raw material production step
TIER 4
Raw materials
production
61%
Change in Group EP&L intensity 2015 to 2022 (EEP&L/€ thousand in revenue, as reported
in 2021 for 2015 to 2021)
7,660
50
2015
15,884
41
37
2019
13,100
39
34
2020
17,645
37
30
2021
O 20,351
PROGRESS TOWARDS 2025 GOALS
2022
35
25
O Revenue: €m
O Targeted reduction in EP&L intensity to achieve the 40% reduction objective by 2025
O EP&L intensity: €EP&L per €1,000 in revenue, with identical EP&L methodology and scope
of calculation and including the 2022 change in method regarding 2021, see methodological note on EP&L,
available on the Kering website, section Sustainability/Reporting and Indicators
50% reduction in our EP&L intensity
between 2015 and 2022
→ Achieving Kering's EP&L target 4 years ahead of time
38View entire presentation