Crocs Investor Presentation Deck
cr
CS
cr
OCS
CI
OC
FINANCIAL OUTLOOK
2023E GUIDANCE
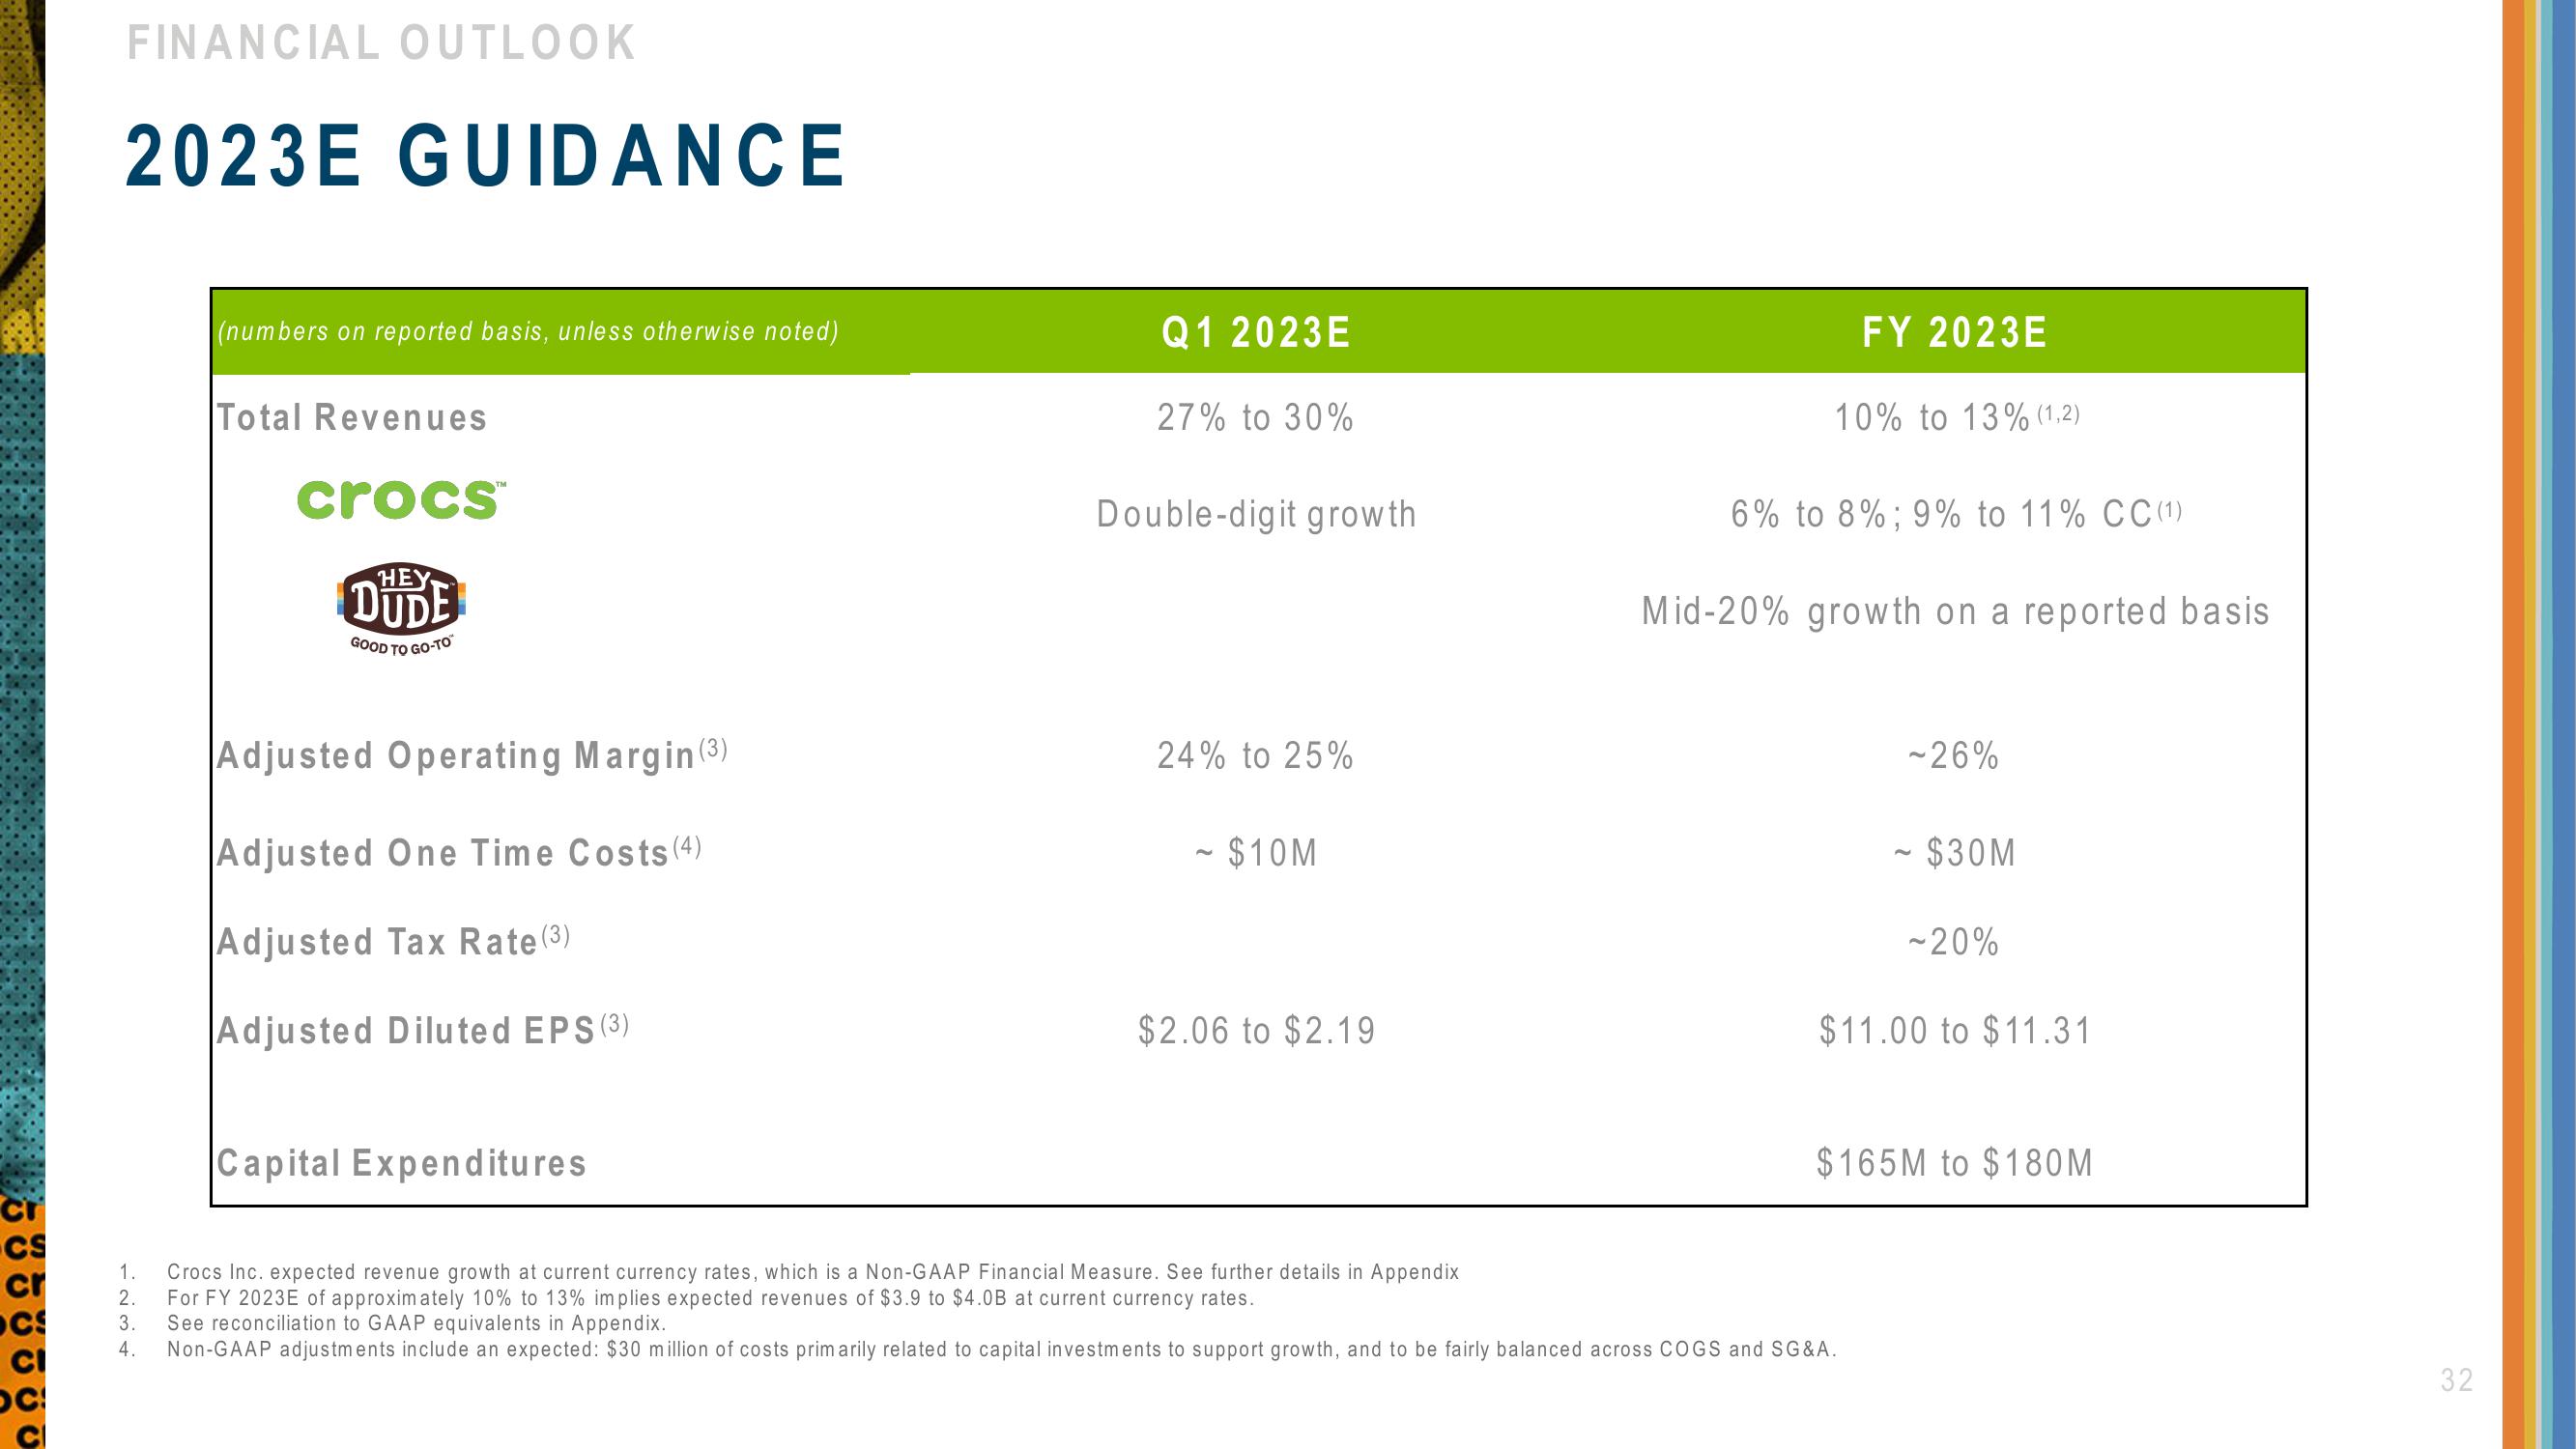
(numbers on reported basis, unless otherwise noted)
Total Revenues
crocs™
HEY
DUDE
GOOD TO GO-TO
Adjusted Operating Margin (³)
Adjusted One Time Costs (4)
Adjusted Tax Rate (3)
Adjusted Diluted EPS (³)
Capital Expenditures
Q1 2023E
27% to 30%
Double-digit growth
24% to 25%
~ $10M
$2.06 to $2.19
FY 2023E
10% to 13% (1,2)
6% to 8%; 9% to 11% CC (1)
Mid-20% growth on a reported basis
-26%
1. Crocs Inc. expected revenue growth at current currency rates, which is a Non-GAAP Financial Measure. See further details in Appendix
For FY 2023E of approximately 10% to 13% implies expected revenues of $3.9 to $4.0B at current currency rates.
2.
3.
See reconciliation to GAAP equivalents in Appendix.
4. Non-GAAP adjustments include an expected: $30 million of costs primarily related to capital investments to support growth, and to be fairly balanced across COGS and SG&A.
~ $30M
-20%
$11.00 to $11.31
$165M to $180M
32View entire presentation