Sonder Results Presentation Deck
Third Quarter 2021 Summary Results
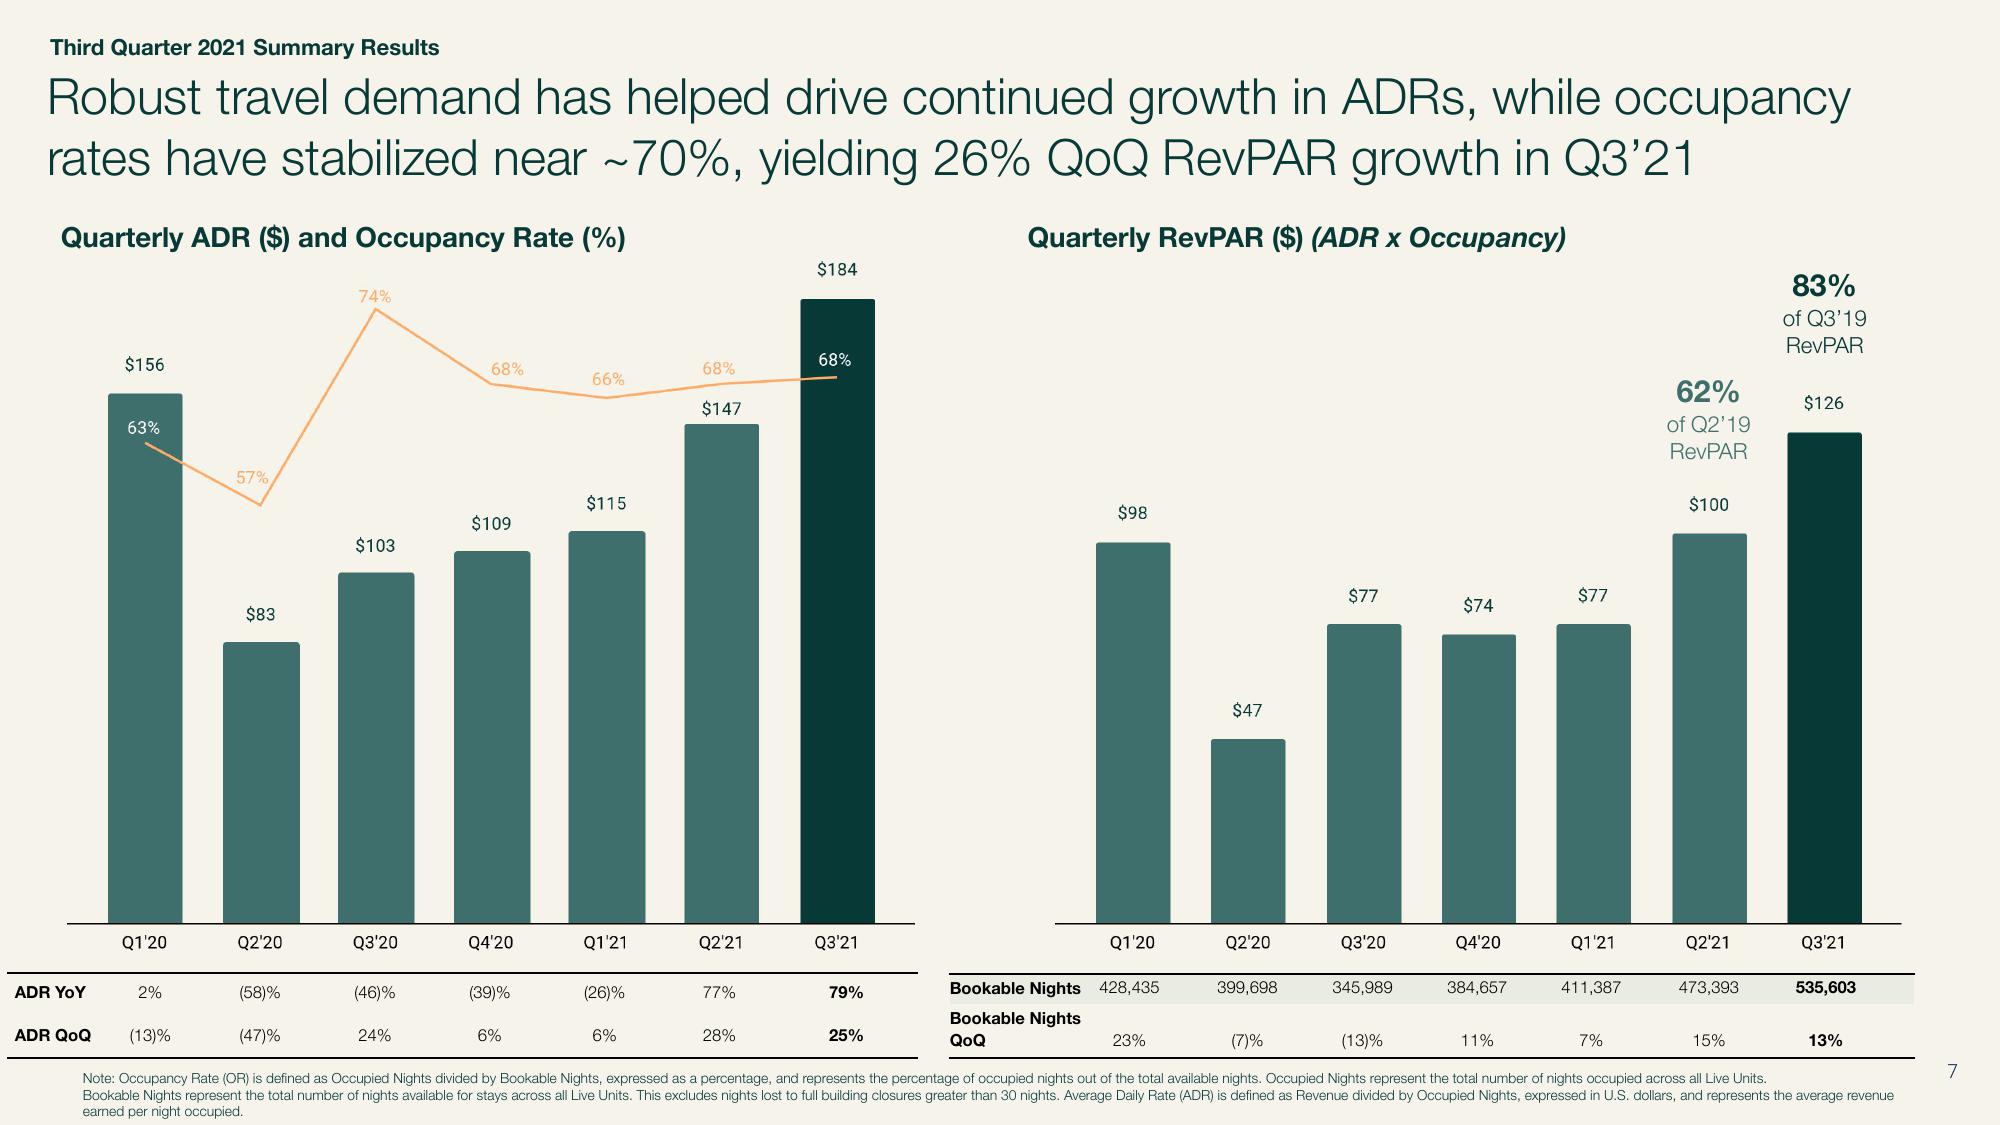
Robust travel demand has helped drive continued growth in ADRs, while occupancy
rates have stabilized near ~70%, yielding 26% QOQ RevPAR growth in Q3'21
Quarterly ADR ($) and Occupancy Rate (%)
Quarterly RevPAR ($) (ADR x Occupancy)
ADR YOY
ADR QoQ
$156
63%
Q1'20
2%
(13)%
57%
$83
Q2'20
(58)%
74%
$103
Q3'20
(46)%
24%
68%
$109
Q4'20
(39)%
6%
66%
$115
Q1'21
(26)%
6%
68%
$147
Q2'21
77%
28%
$184
68%
Q3'21
79%
25%
$98
Q1'20
Bookable Nights 428,435
Bookable Nights
QoQ
$47
23%
Q2'20
399,698
$77
Q3'20
345,989
$74
Q4'20
384,657
$77
11%
Q1'21
411,387
62%
of Q2'19
RevPAR
(47)%
(7)%
(13)%
Note: Occupancy Rate (OR) is defined as Occupied Nights divided by Bookable Nights, expressed as a percentage, and represents the percentage of occupied nights out of the total available nights. Occupied Nights represent the total number of nights occupied across all Live Units.
Bookable Nights represent the total number of nights available for stays across all Live Units. This excludes nights lost to full building closures greater than 30 nights. Average Daily Rate (ADR) is defined as Revenue divided by Occupied Nights, expressed in U.S. dollars, and represents the average revenue
earned per night occupied.
7%
$100
Q2'21
473,393
83%
of Q3'19
RevPAR
15%
$126
Q3'21
535,603
13%
7View entire presentation