Telia Company Results Presentation Deck
GROUP HIGHLIGHTS
2
●
●
●
●
●
●
●
●
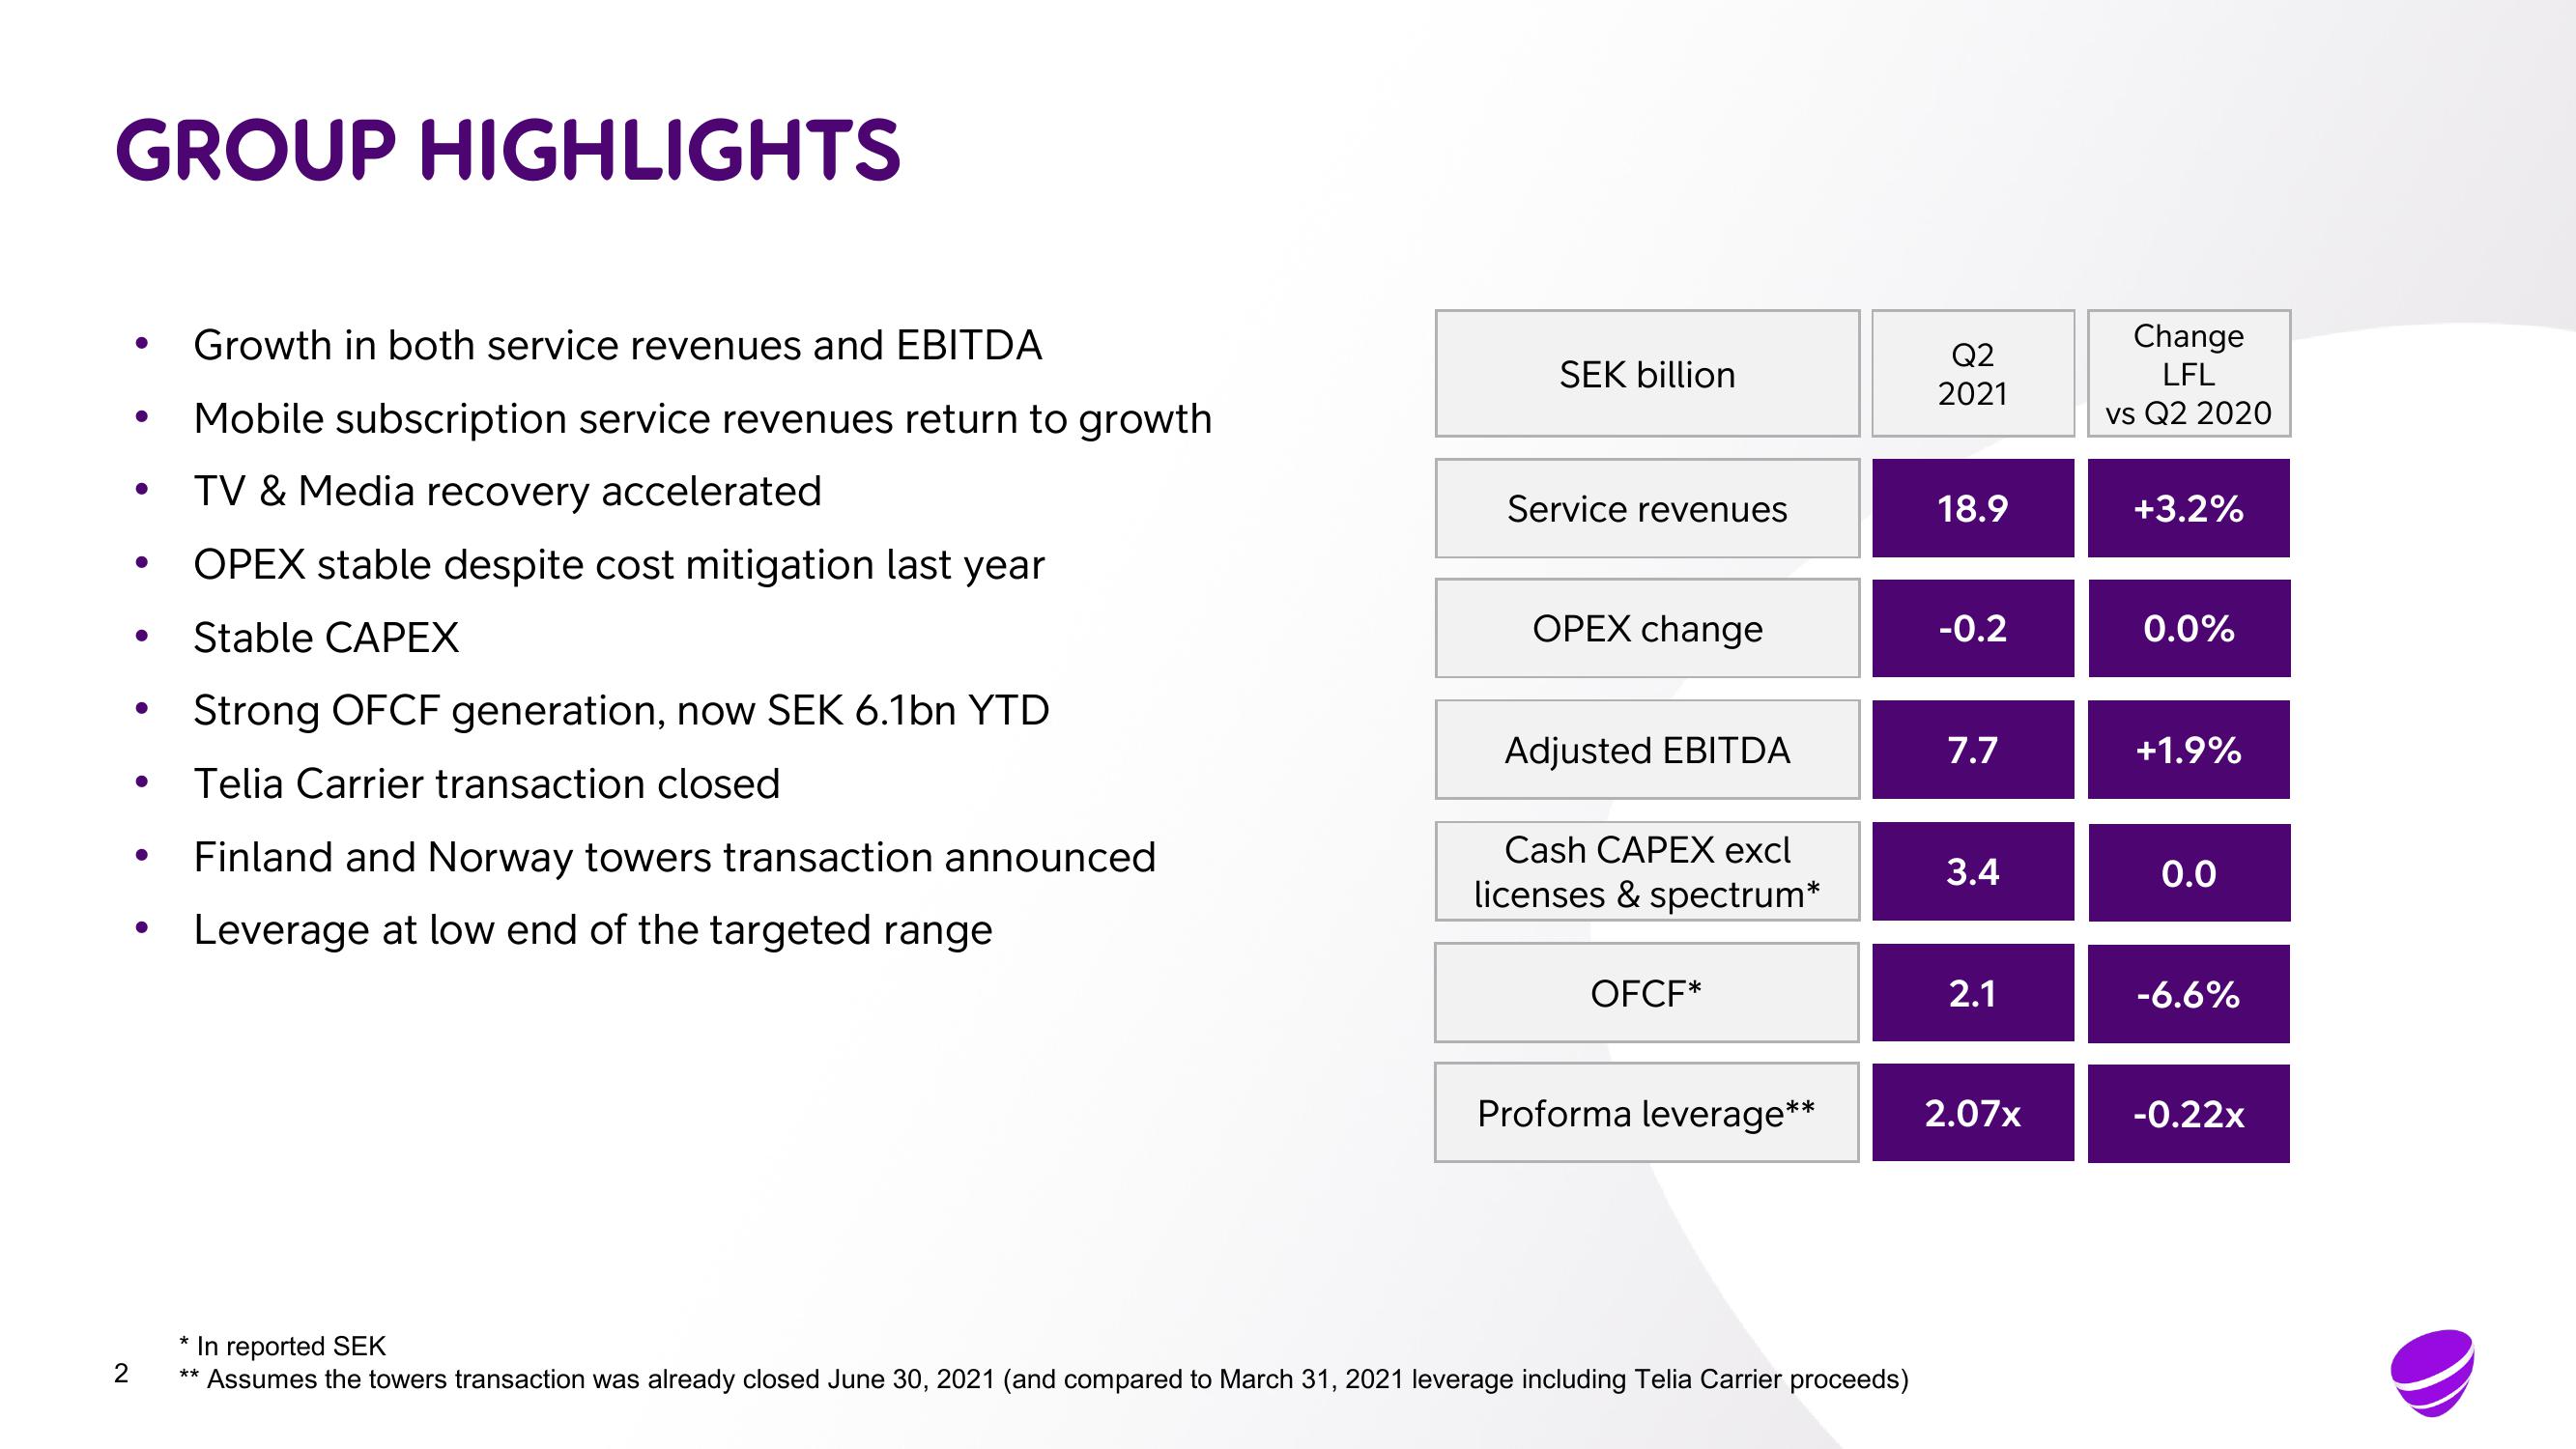
Growth in both service revenues and EBITDA
Mobile subscription service revenues return to growth
TV & Media recovery accelerated
OPEX stable despite cost mitigation last year
Stable CAPEX
Strong OFCF generation, now SEK 6.1bn YTD
Telia Carrier transaction closed
Finland and Norway towers transaction announced
Leverage at low end of the targeted range
SEK billion
Service revenues
OPEX change
Adjusted EBITDA
Cash CAPEX excl
licenses & spectrum*
OFCF*
Proforma leverage**
* In reported SEK
**
Assumes the towers transaction was already closed June 30, 2021 (and compared to March 31, 2021 leverage including Telia Carrier proceeds)
Q2
2021
18.9
-0.2
7.7
3.4
2.1
2.07x
Change
LFL
vs Q2 2020
+3.2%
0.0%
+1.9%
0.0
-6.6%
-0.22xView entire presentation