Babylon Investor Presentation Deck
Babylon at a Glance...
10
Scale
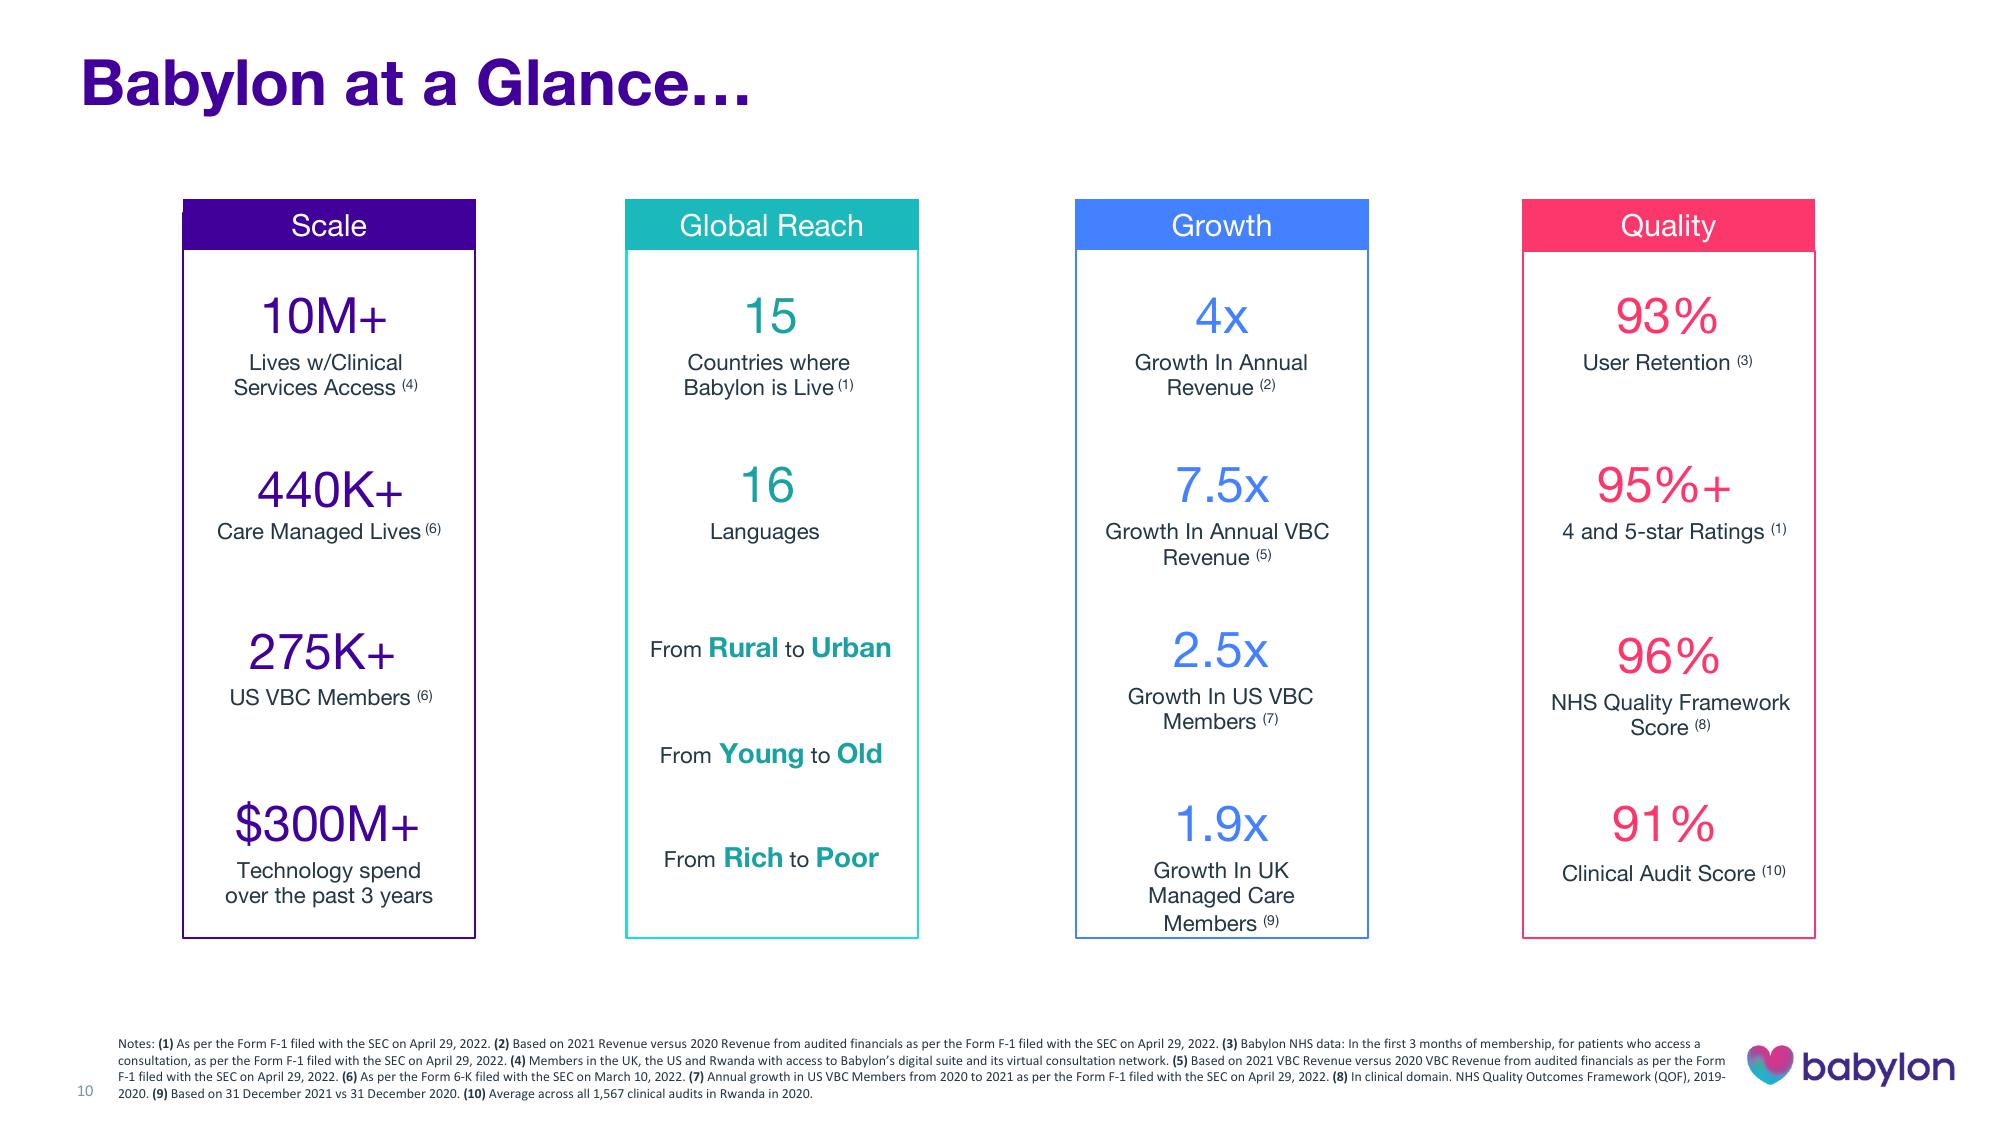
10M+
Lives w/Clinical
Services Access (4).
440K+
Care Managed Lives (6)
275K+
US VBC Members (6)
$300M+
Technology spend
over the past 3 years
Global Reach
15
Countries where
Babylon is Live (1)
16
Languages
From Rural to Urban
From Young to Old
From Rich to Poor
Growth
4x
Growth In Annual
Revenue (2)
7.5x
Growth In Annual VBC
Revenue (5)
2.5x
Growth In US VBC
Members (7)
1.9x
Growth In UK
Managed Care
Members (9)
Quality
93%
User Retention (3)
95%+
4 and 5-star Ratings (1)
96%
NHS Quality Framework
Score (8)
91%
Clinical Audit Score (10)
Notes: (1) As per the Form F-1 filed with the SEC on April 29, 2022. (2) Based on 2021 Revenue versus 2020 Revenue from audited financials as per the Form F-1 filed with the SEC on April 29, 2022. (3) Babylon NHS data: In the first 3 months of membership, for patients who access a
consultation, as per the Form F-1 filed with the SEC on April 29, 2022. (4) Members in the UK, the US and Rwanda with access to Babylon's digital suite and its virtual consultation network. (5) Based on 2021 VBC Revenue versus 2020 VBC Revenue from audited financials as per the Form
F-1 filed with the SEC on April 29, 2022. (6) As per the Form 6-K filed with the SEC on March 10, 2022. (7) Annual growth in US VBC Members from 2020 to 2021 as per the Form F-1 filed with the SEC on April 29, 2022. (8) In clinical domain. NHS Quality Outcomes Framework (QOF), 2019-
2020. (9) Based on 31 December 2021 vs 31 December 2020. (10) Average across all 1,567 clinical audits in Rwanda in 2020.
babylonView entire presentation