Maersk Results Presentation Deck
A.P. Moller Maersk Group
- Interim Report 02 2015
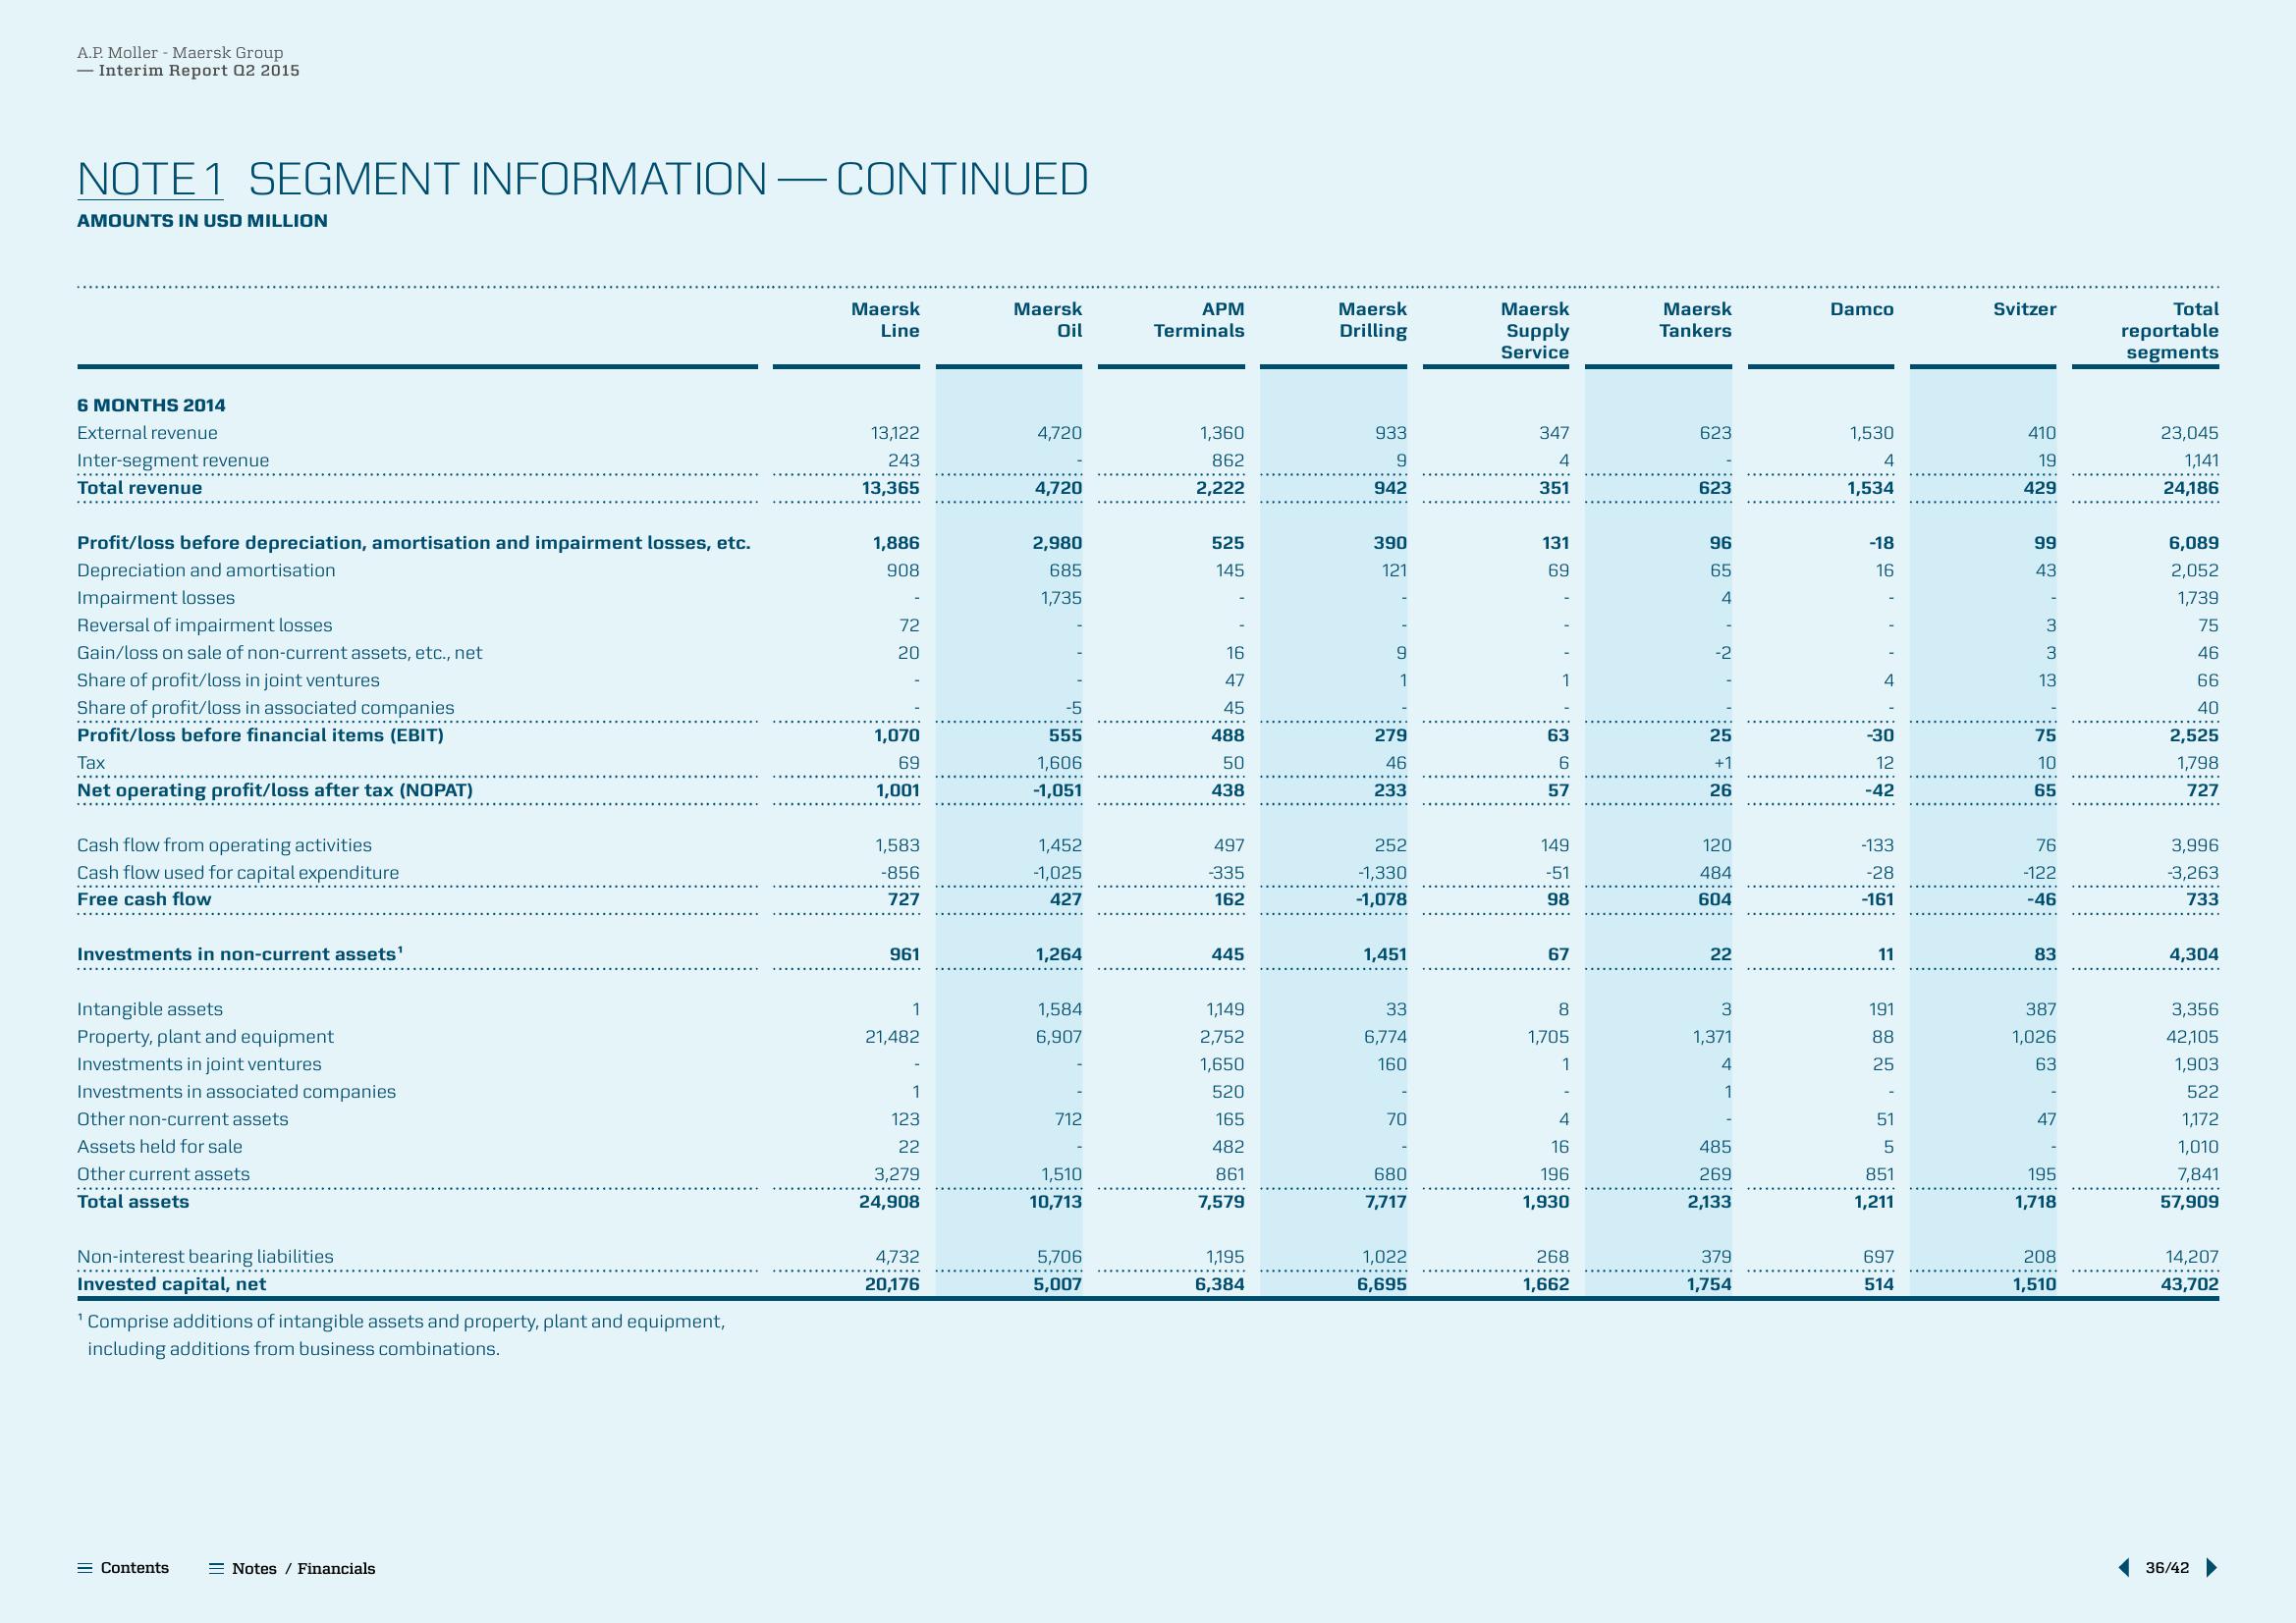
NOTE 1 SEGMENT INFORMATION - CONTINUED
AMOUNTS IN USD MILLION
6 MONTHS 2014
External revenue
Inter-segment revenue
Total revenue
Profit/loss before depreciation, amortisation and impairment losses, etc.
Depreciation and amortisation
Impairment losses
Reversal of impairment losses
Gain/loss on sale of non-current assets, etc., net
Share of profit/loss in joint ventures
Share of profit/loss in associated companies
Profit/loss before financial items (EBIT)
..……..…….....
Tax
Net operating profit/loss after tax (NOPAT)
Cash flow from operating activities
Cash flow used for capital expenditure
Free cash flow
Investments in non-current assets¹
Intangible assets
Property, plant and equipment
Investments in joint ventures
Investments in associated companies
Other non-current assets
Assets held for sale
Other current assets
Total assets
Non-interest bearing liabilities
Invested capital, net
¹ Comprise additions of intangible assets and property, plant and equipment,
including additions from business combinations.
= Contents
Notes / Financials
Maersk
Line
13,122
243
13,365
1,886
908
72
20
1,070
69
1,001
1,583
-856
727
961
1
21,482
1
123
22
3,279
24,908
4,732
20,176
Maersk
Oil
4,720
4,720
2,980
685
1,735
-5
555
1,606
-1,051
1,452
-1,025
427
1,264
1,584
6,907
712
1,510
10,713
5,706
5,007
APM
Terminals
1,360
862
2,222
525
145
16
47
45
488
50
438
497
-335
162
445
1,149
2,752
1,650
520
165
482
861
7,579
1,195
6,384
Maersk
Drilling
933
9
942
390
121
9
1
279
46
233
252
-1,330
-1,078
1,451
33
6,774
160
70
680
7,717
1,022
6,695
Maersk
Supply
Service
347
4
351
131
69
1
63
6
57
149
-51
98
67
8
1,705
1
4
16
196
1,930
268
1,662
Maersk
Tankers
623
623
96
65
4
-2
25
+1
26
120
484
604
22
3
1,371
4
1
485
269
2,133
379
1,754
Damco
1,530
4
1,534
-18
16
4
-30
12
-42
-133
-28
-161
11
191
88
25
51
5
851
1,211
697
514
Svitzer
410
19
429
99
43
-
3
3
13
75
10
65
76
-122
-46
83
387
1,026
63
47
195
1,718
208
1,510
Total
reportable
segments
23,045
1,141
24,186
6,089
2,052
1,739
75 46 66
40
2,525
1,798
727
3,996
-3,263
733
4,304
3,356
42,105
1,903
522
1,172
1,010
7,841
57,909
14,207
43,702
36/42View entire presentation