Baird Investment Banking Pitch Book
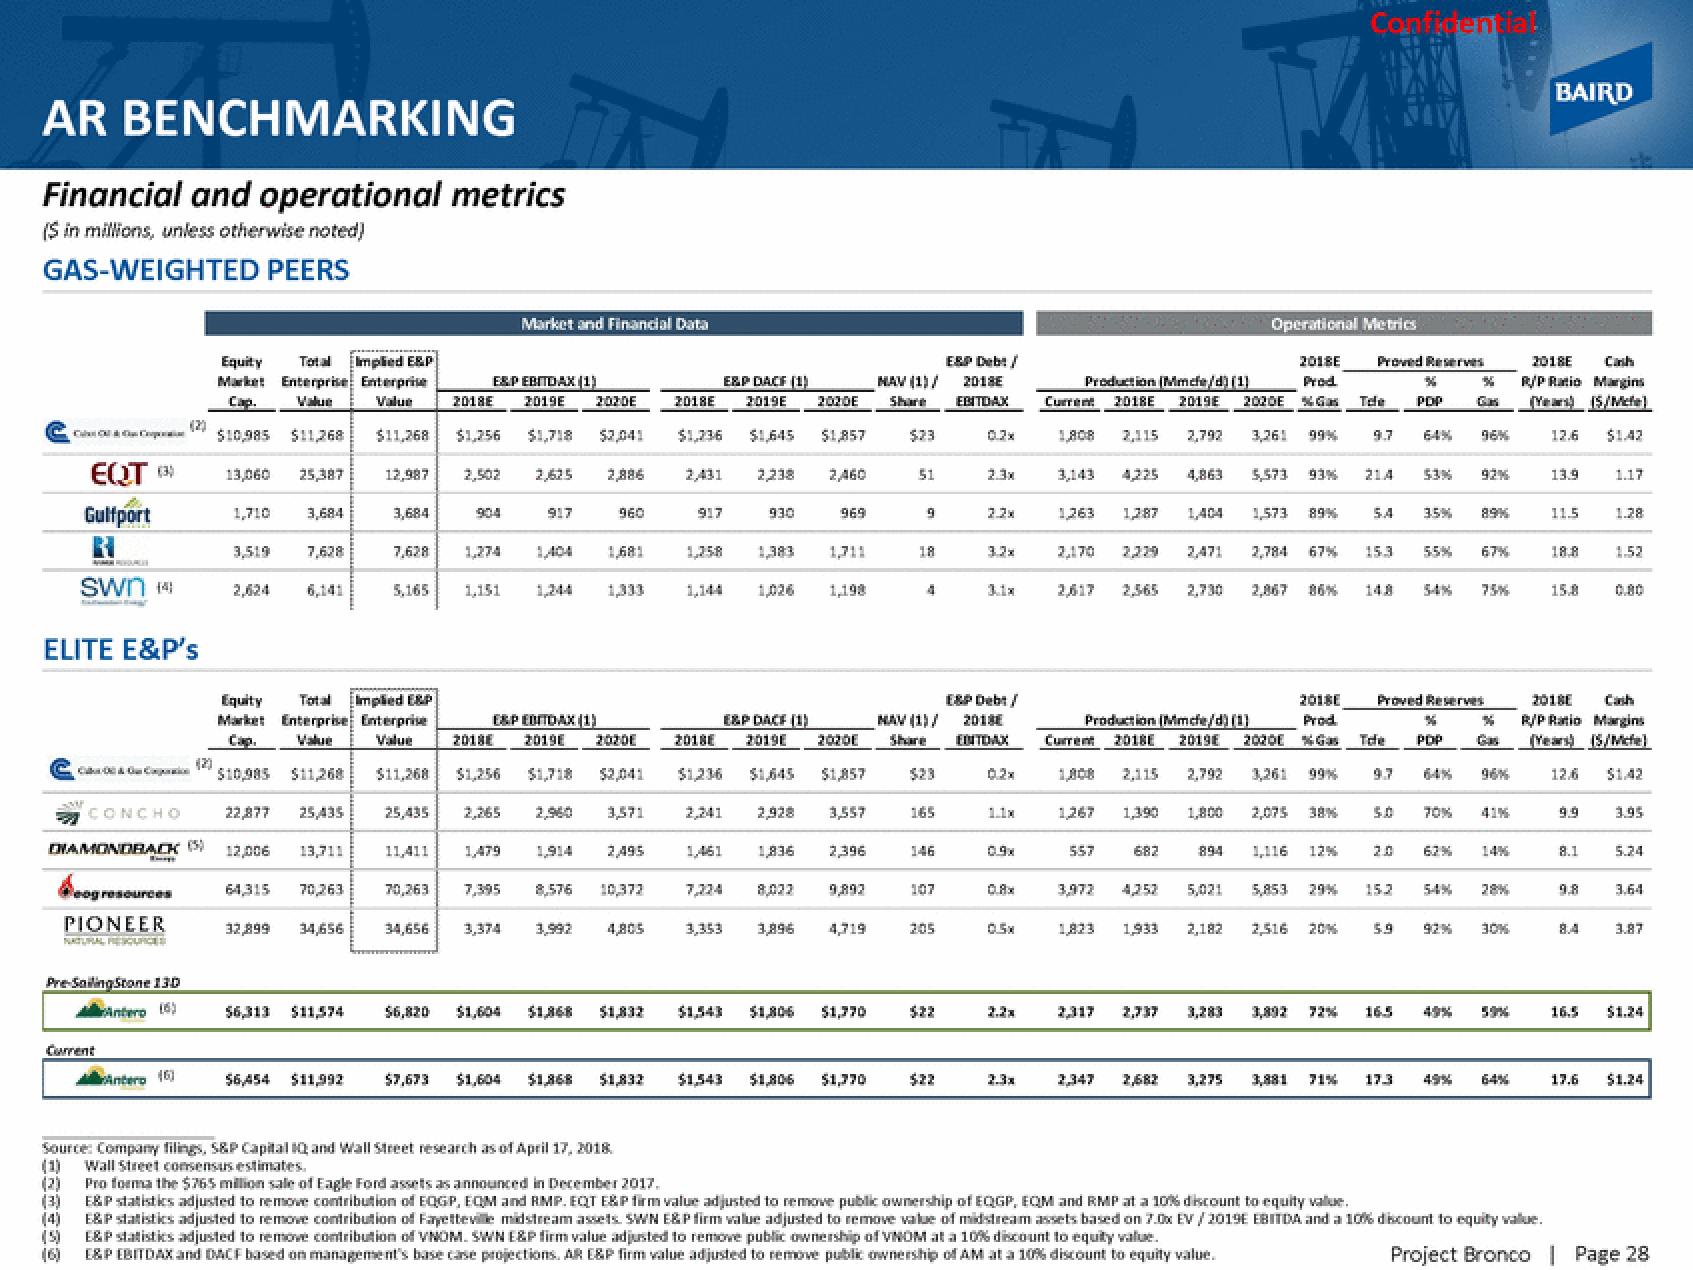
AR BENCHMARKING
Financial and operational metrics
($ in millions, unless otherwise noted)
GAS-WEIGHTED PEERS
EQT (3)
Gulfport
ELITE E&P's
Corpora
swn (4)
Beogre
(1)
(2)
(3)
C&C
(4)
(5)
Current
Simpt
og resources
Pre-Sailing Stone 130
Antero (6)
PIONEER
NATURAL RESOURCES
Equity
Total Implied E&P
Market Enterprise Enterprise
Value
Value
$10,985 $11,268
CONCHO
22,877
25,435
DIAMONDBACK (5) 12,006
Antero (6)
Equity Total Implied E&P
Market Enterprise Enterprise
Cap. Value
Value
$10,985 $11,268 $11,268
(20
13,060 25,387
1,710
3,519
3,684
64,315
7,628
13,711
70,263
32,899 34,656
$6,313 $11,574
$6,454 $11,992
12,987 2,502
3,684
7,628
5,165
ESP EBITDAX (1)
2018E 2019E 2020E
$1,256
1,274
1.151
Market and Financial Data
25,435 2,265
2,625 2,886
EXPEDITDAX (1)
2018E 2019E 2020E
$11,268 $1,256 $1,718
$7,673 $1,604
960
3,571
11,411 1,479
70,263 7,395 8,576 10,372
34,656 3,374 3,992
4,805
2,495
$6,820 $1,604 $1,868 $1,832
Source: Company filings, S&P Capital IQ and Wall Street research as of April 17, 2018.
Wall Street consensus estimates.
$1,832
ESP DACF (1)
2018E 2019E
$1,645
$1,236
2,431
917
2018E
2,241
1,461
3,353
2,238
930
1,383
E&P DACE (1)
2019E
$1,645
1,836
8.033
3,896
$1,806
2020E
$1,543 $1,806
$1,857
2,460
969
2,928 3,557
1,311
1,198
2020E
$1,857
2,396
4,719
$1,770
$1,770
E&P Debt/
NAV (1)/ 2018E
Share EBITDAX
$23
51
9
18
4
165
107
0.2 x
205
2.2x
NAV (1)/
Share EDITOAX
3.2x
E&P Debt /
02x
09x
0.5x
2.2x
2.3x
2018E
Production (Mmcfe/d) (1)
Prod
2018E
2019E 2020E Gas
3,261 99%
Current
1,808 2,115 2,792
3,143
1,263 1,387
1,267
557
1,404
2,471
682
2018E
Prod.
Production (Mmche/d) (1)
Current 2018E 2019E 2020 %Gas
2,115
894
Operational Metrics
3.972 4,357 5,021
5,573 93%
1,390 1,800 2,075
1,823 1,933 2,182
1,573 89%
2,784
99%
1,116 12%
5,853
29%
2,516 20%
Conficen la
3,892 72%
Proved Reserves
X
PDP
Tele
9.7
214
5.4
15.3
Tde
9.7
50
20
152
3.5%
55%
Proved Reserves
2,347 2,682 3,275 3,881 71% 17.3
%
PDP
70%
*
Gas
54%
96%
92%
89%
67%
%
96%
5.9 92% 30%
16.5 49% 59%
BAIRD
2018E Canh
R/P Ratio Margins
(Y) (S/Mche
12.6 $1.42
13.9
11.5
18.8
15.8
9.9
8.1
2018E
R/P Ratio Margins
(Years) (S/Mche]
12.6
9.8
16.5
1.17
17.6
1.28
1.52
3.95
5.24
3.64
3.87
$1.24
Pro forma the $765 million sale of Eagle Ford assets as announced in December 2017.
E&P statistics adjusted to remove contribution of EQGP, EQM and RMP. EQT E&P firm value adjusted to remove public ownership of EQGP, EQM and RMP at a 10% discount to equity value.
E&P statistics adjusted to remove contribution of Fayetteville midstream assets. SWN E&P firm value adjusted to remove value of midstream assets based on 7.0x EV /2019E EBITDA and a 10% discount to equity value.
E&P statistics adjusted to remove contribution of VNOM. SWN E&P firm value adjusted to remove public ownership of VNOM at a 10% discount to equity value.
E&P EBITDAX and DACF based on management's base case projections. AR E&P firm value adjusted to remove public ownership of AM at a 10% discount to equity value.
Project Bronco | Page 28View entire presentation