Experian Investor Presentation Deck
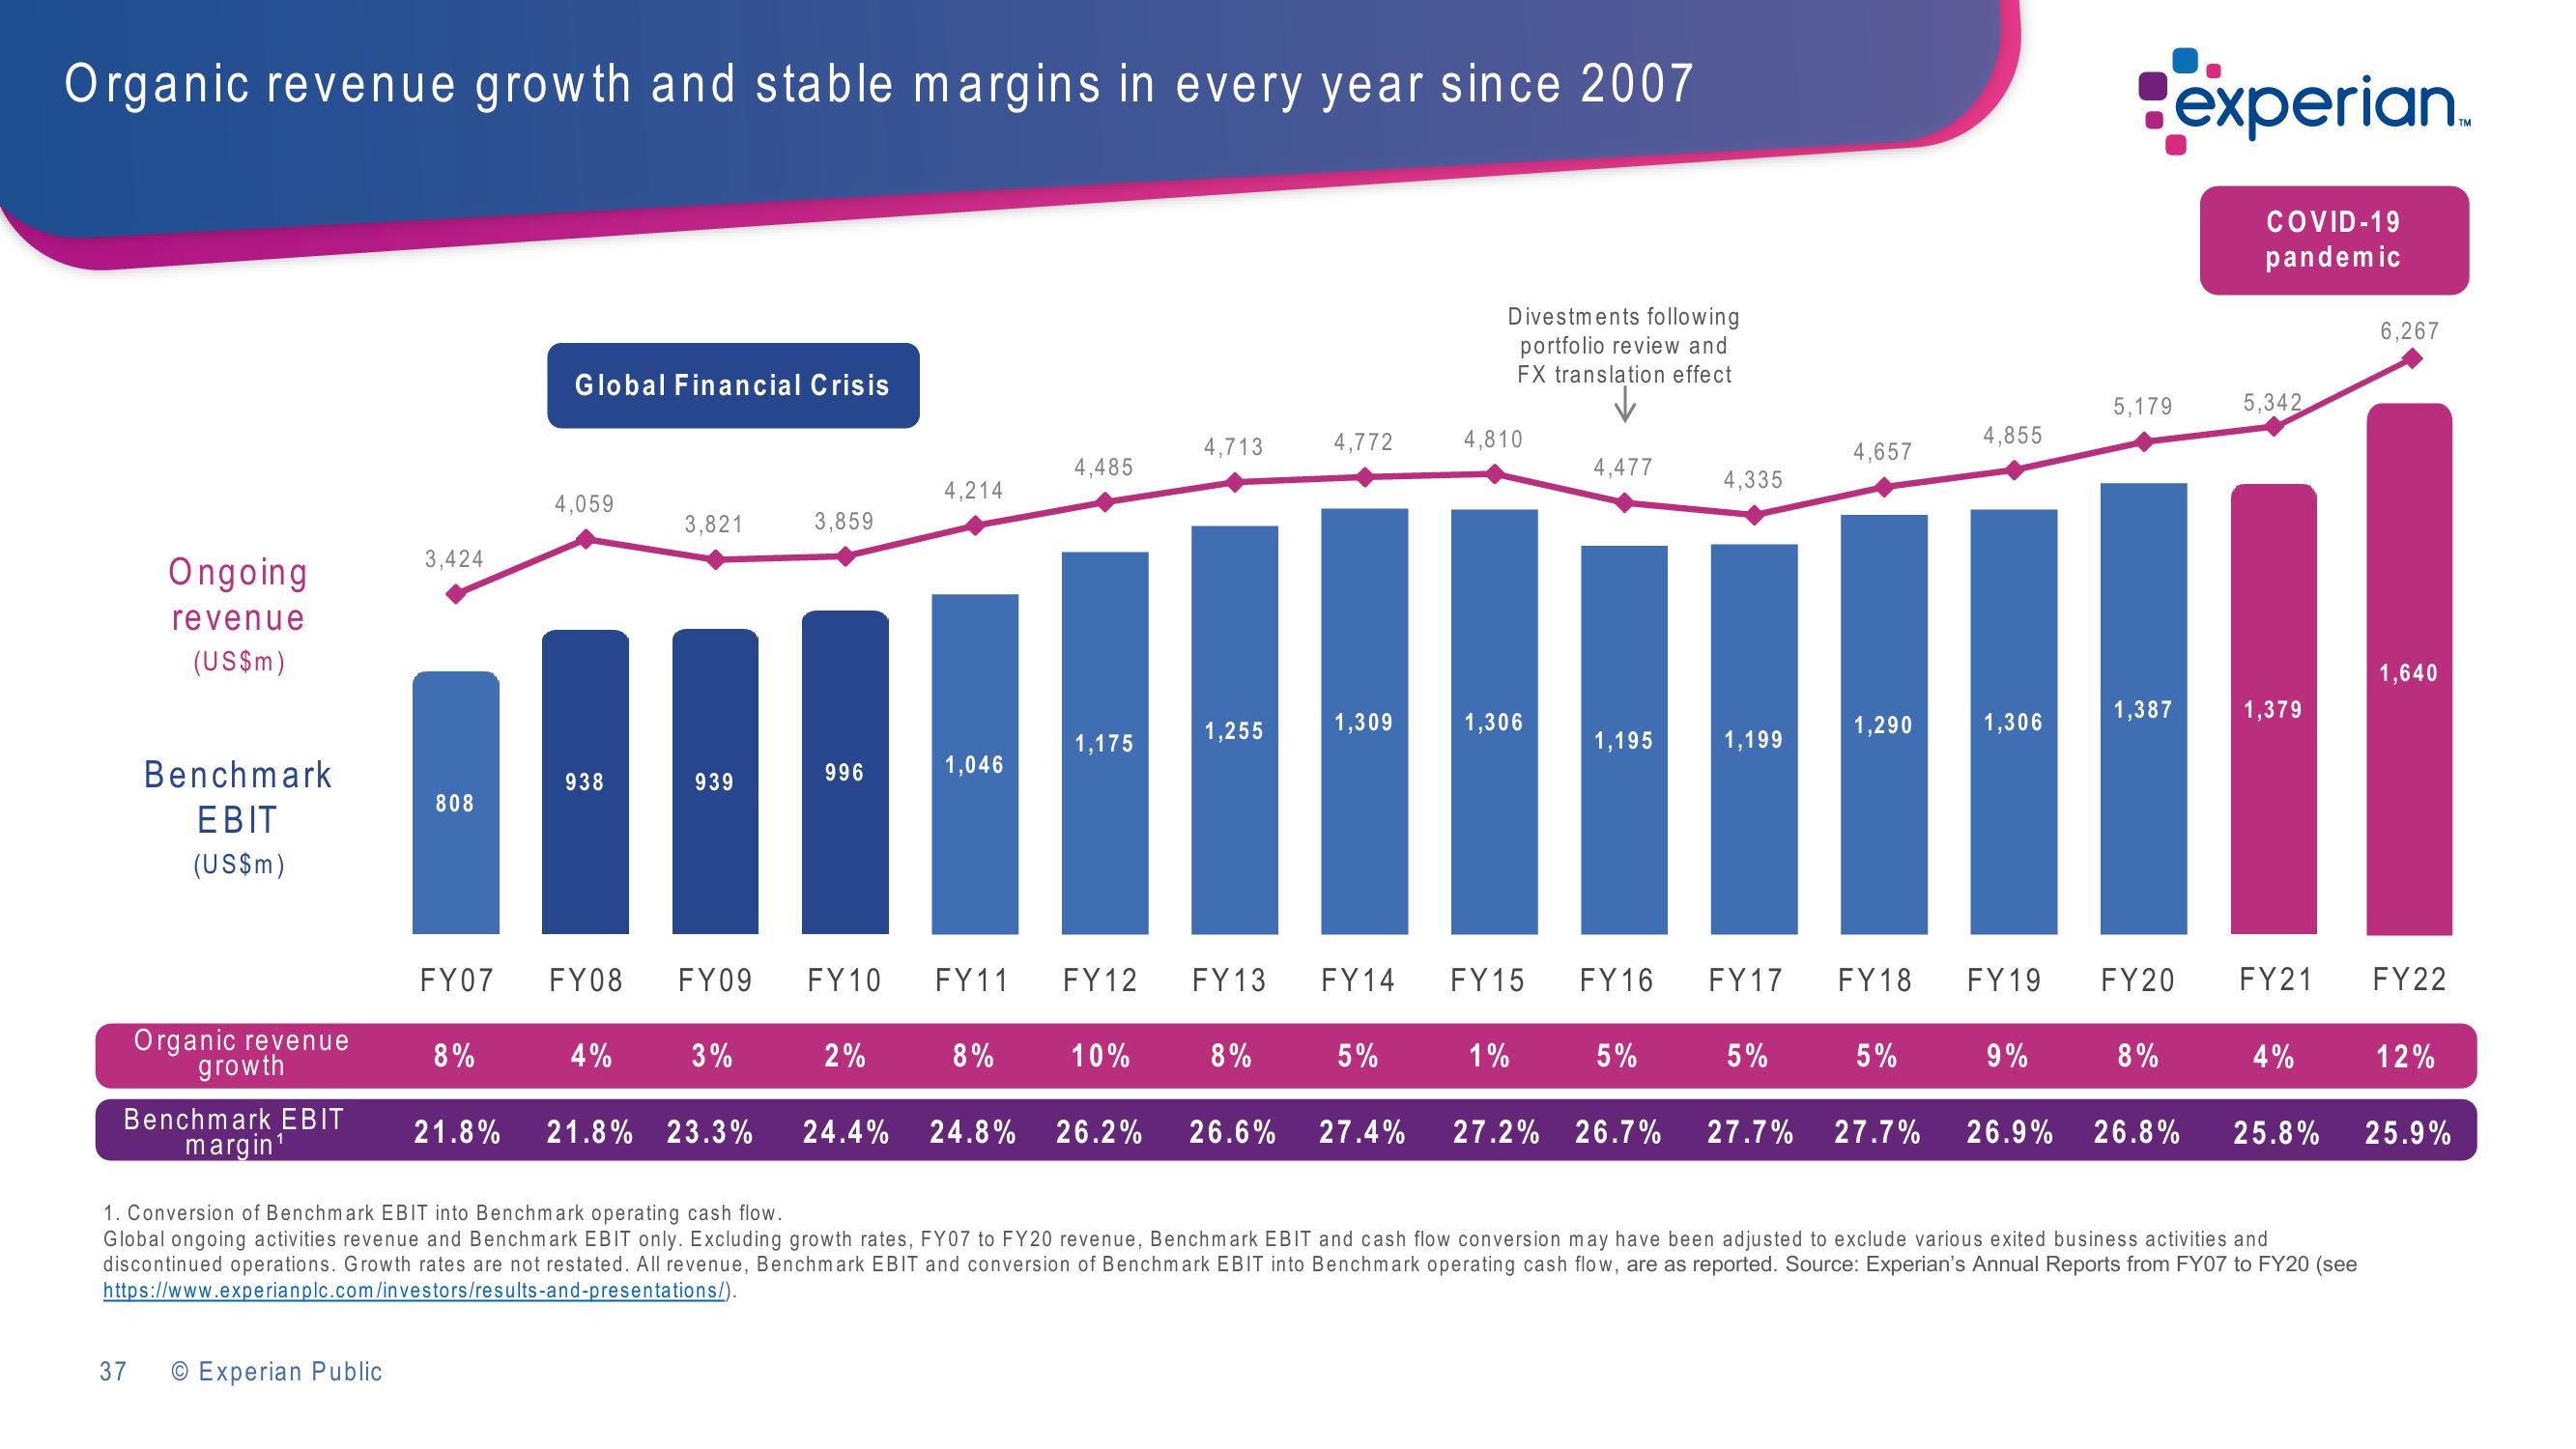
Organic revenue growth and stable margins in every year since 2007
Ongoing
revenue
(US$m)
Benchmark
EBIT
(US$m)
37
Organic revenue
growth
Benchmark EBIT
margin¹
3,424
O Experian Public
808
FY07
8%
Global Financial Crisis
4,059
3,821
4%
939
938
I
FY08 FY09 FY10 FY11 FY12
3%
3,859
21.8% 21.8% 23.3%
996
4,214
2%
1,046
8%
4,485
24.4% 24.8%
1,175
10%
4,713
1,255
4,772
8%
1,309
FY13 FY14
5%
Divestments following
portfolio review and
FX translation effect
4,810
1,306
FY15
1%
4,477
1,195
FY16
5%
26.2% 26.6% 27.4% 27.2% 26.7%
4,335
1,199
FY17
5%
4,657
1,290
FY18
5%
4,855
1,306
FY 19
9%
experian.
COVID-19
pandemic
5,179
1,387
FY20
8%
5,342
1,379
FY21
4%
1. Conversion of Benchmark EBIT into Benchmark operating cash flow.
Global ongoing activities revenue and Benchmark EBIT only. Excluding growth rates, FY07 to FY20 revenue, Benchmark EBIT and cash flow conversion may have been adjusted to exclude various exited business activities and
discontinued operations. Growth rates are not restated. All revenue, Benchmark EBIT and conversion of Benchmark EBIT into Benchmark operating cash flow, are as reported. Source: Experian's Annual Reports from FY07 to FY20 (see
https://www.experianplc.com/investors/results-and-presentations/).
27.7% 27.7% 26.9% 26.8% 25.8%
6,267
1,640
FY22
12%
25.9%View entire presentation