AMC Investor Day Presentation Deck
5 Continued Recliner Reseat Enhancements
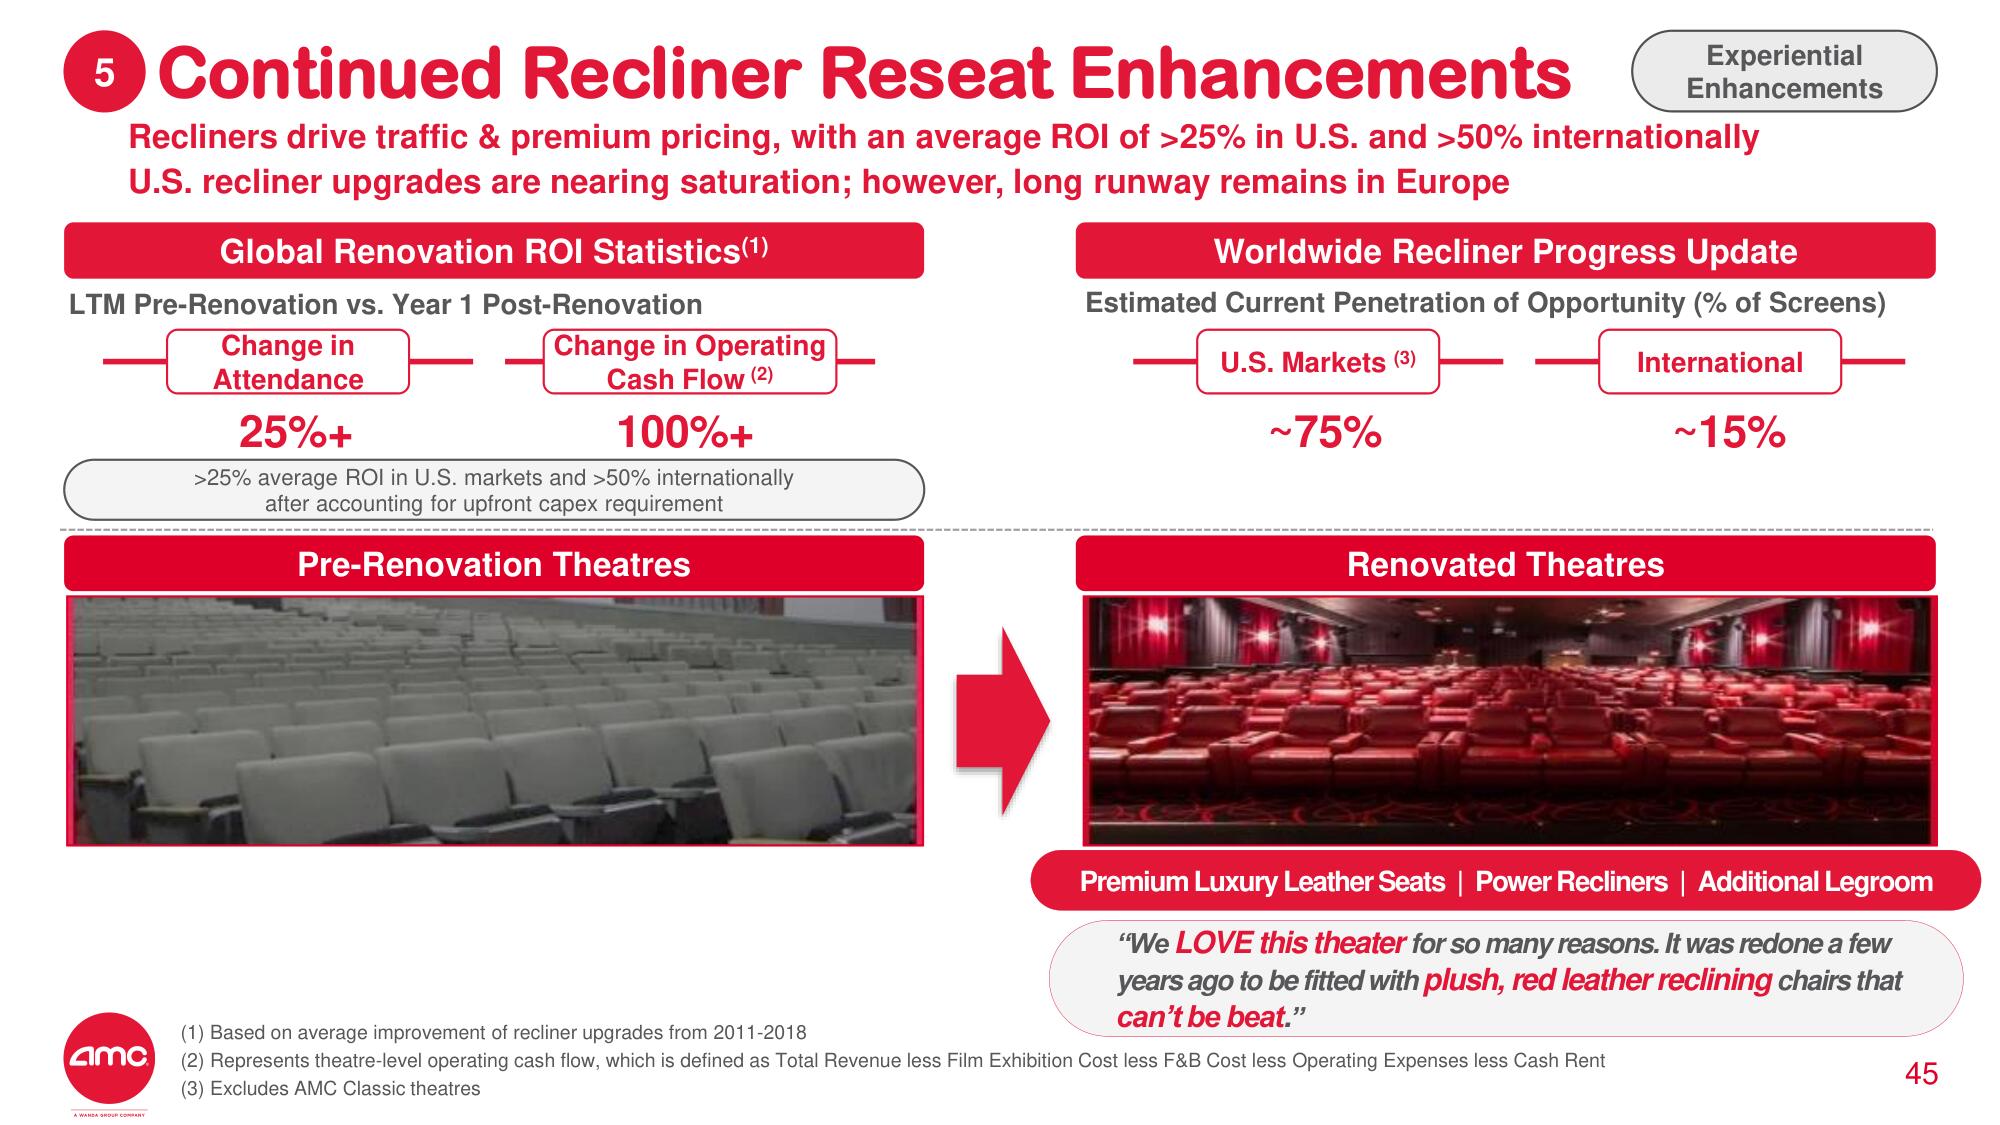
Recliners drive traffic & premium pricing, with an average ROI of >25% in U.S. and >50% internationally
U.S. recliner upgrades are nearing saturation; however, long runway remains in Europe
Global Renovation ROI Statistics (1)
LTM Pre-Renovation vs. Year 1 Post-Renovation
amc
Change in Operating
Cash Flow (2)
25%+
100%+
>25% average ROI in U.S. markets and >50% internationally
after accounting for upfront capex requirement
Pre-Renovation Theatres
Change in
Attendance
Experiential
Enhancements
Worldwide Recliner Progress Update
Estimated Current Penetration of Opportunity (% of Screens)
U.S. Markets (3)
International
~75%
~15%
Renovated Theatres
Premium Luxury Leather Seats | Power Recliners | Additional Legroom
"We LOVE this theater for so many reasons. It was redone a few
years ago to be fitted with plush, red leather reclining chairs that
can't be beat."
(1) Based on average improvement of recliner upgrades from 2011-2018
(2) Represents theatre-level operating cash flow, which is defined as Total Revenue less Film Exhibition Cost less F&B Cost less Operating Expenses less Cash Rent
(3) Excludes AMC Classic theatres
45View entire presentation