Solar Industry Update
•
•
Reported Price of U.S. Utility-Scale
PV Projects Over Time
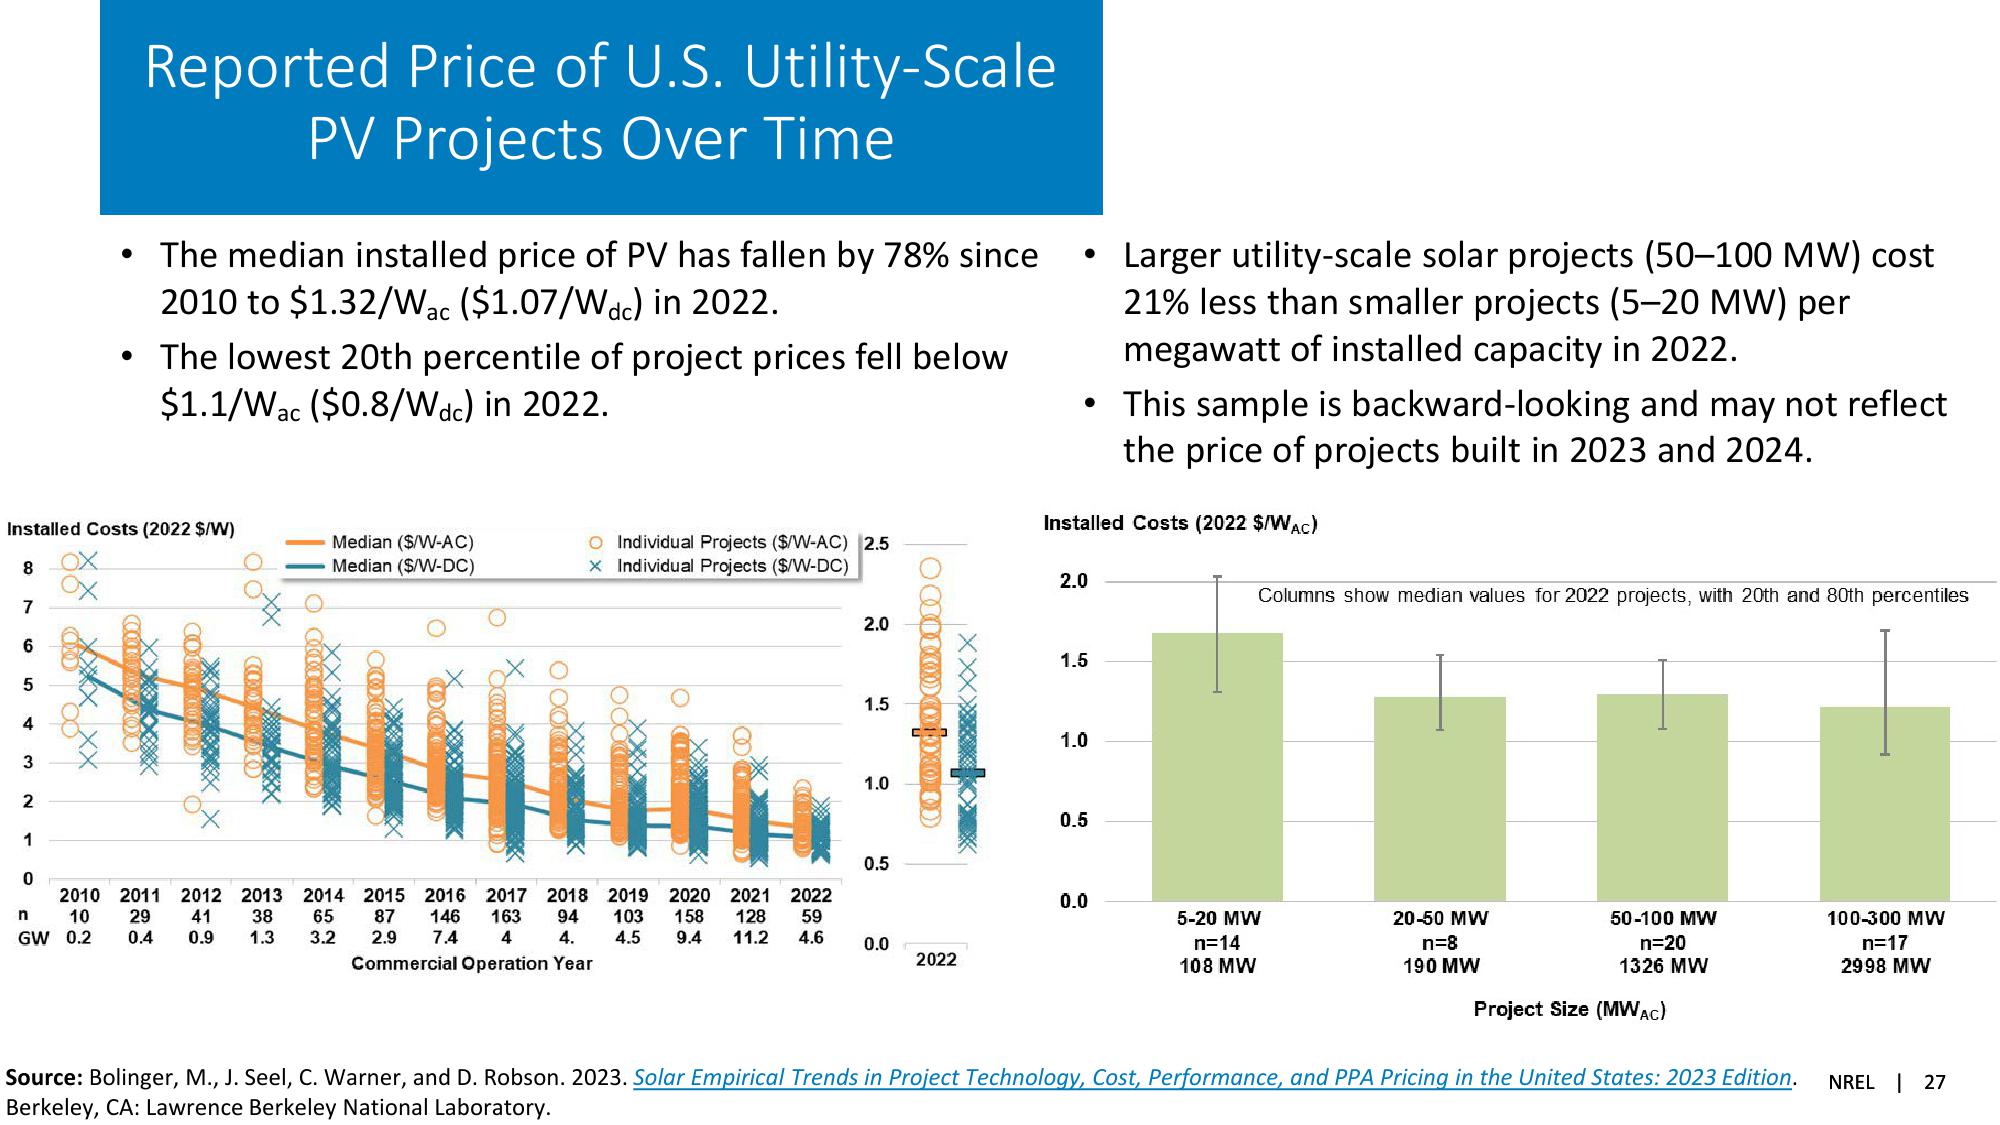
The median installed price of PV has fallen by 78% since
2010 to $1.32/Wac ($1.07/Wdc) in 2022.
The lowest 20th percentile of project prices fell below
$1.1/Wac ($0.8/Wdc) in 2022.
•
•
Larger utility-scale solar projects (50-100 MW) cost
21% less than smaller projects (5-20 MW) per
megawatt of installed capacity in 2022.
This sample is backward-looking and may not reflect
the price of projects built in 2023 and 2024.
Installed Costs (2022 $/WAC)
Installed Costs (2022 $/W)
8
7
6
5
4
3
xx xxxx xx
Median ($/W-AC)
Median ($/W-DC)
O Individual Projects ($/W-AC) 2.5
x Individual Projects ($/W-DC)
2.0
2.0
1.5
1.5
1.0
1.0
2
0.5
1
0.5
0
n
2010 2011 2012 2013
10 29 41
GW 0.2 0.4 0.9
38
1.3
2014 2015 2016 2017 2018
65
3.2
87 146 163 94
2.9 7.4 4
4.
Commercial Operation Year
2019 2020 2021 2022
103 158 128 59
4.5
9.4 11.2 4.6
0.0
2022
Columns show median values for 2022 projects, with 20th and 80th percentiles
0.0
5-20 MW
n=14
108 MW
20-50 MW
n=8
190 MW
50-100 MW
n=20
1326 MW
Project Size (MWAC)
Source: Bolinger, M., J. Seel, C. Warner, and D. Robson. 2023. Solar Empirical Trends in Project Technology, Cost, Performance, and PPA Pricing in the United States: 2023 Edition.
Berkeley, CA: Lawrence Berkeley National Laboratory.
100-300 MW
n=17
2998 MW
NREL 27View entire presentation