Frontier IPO Presentation Deck
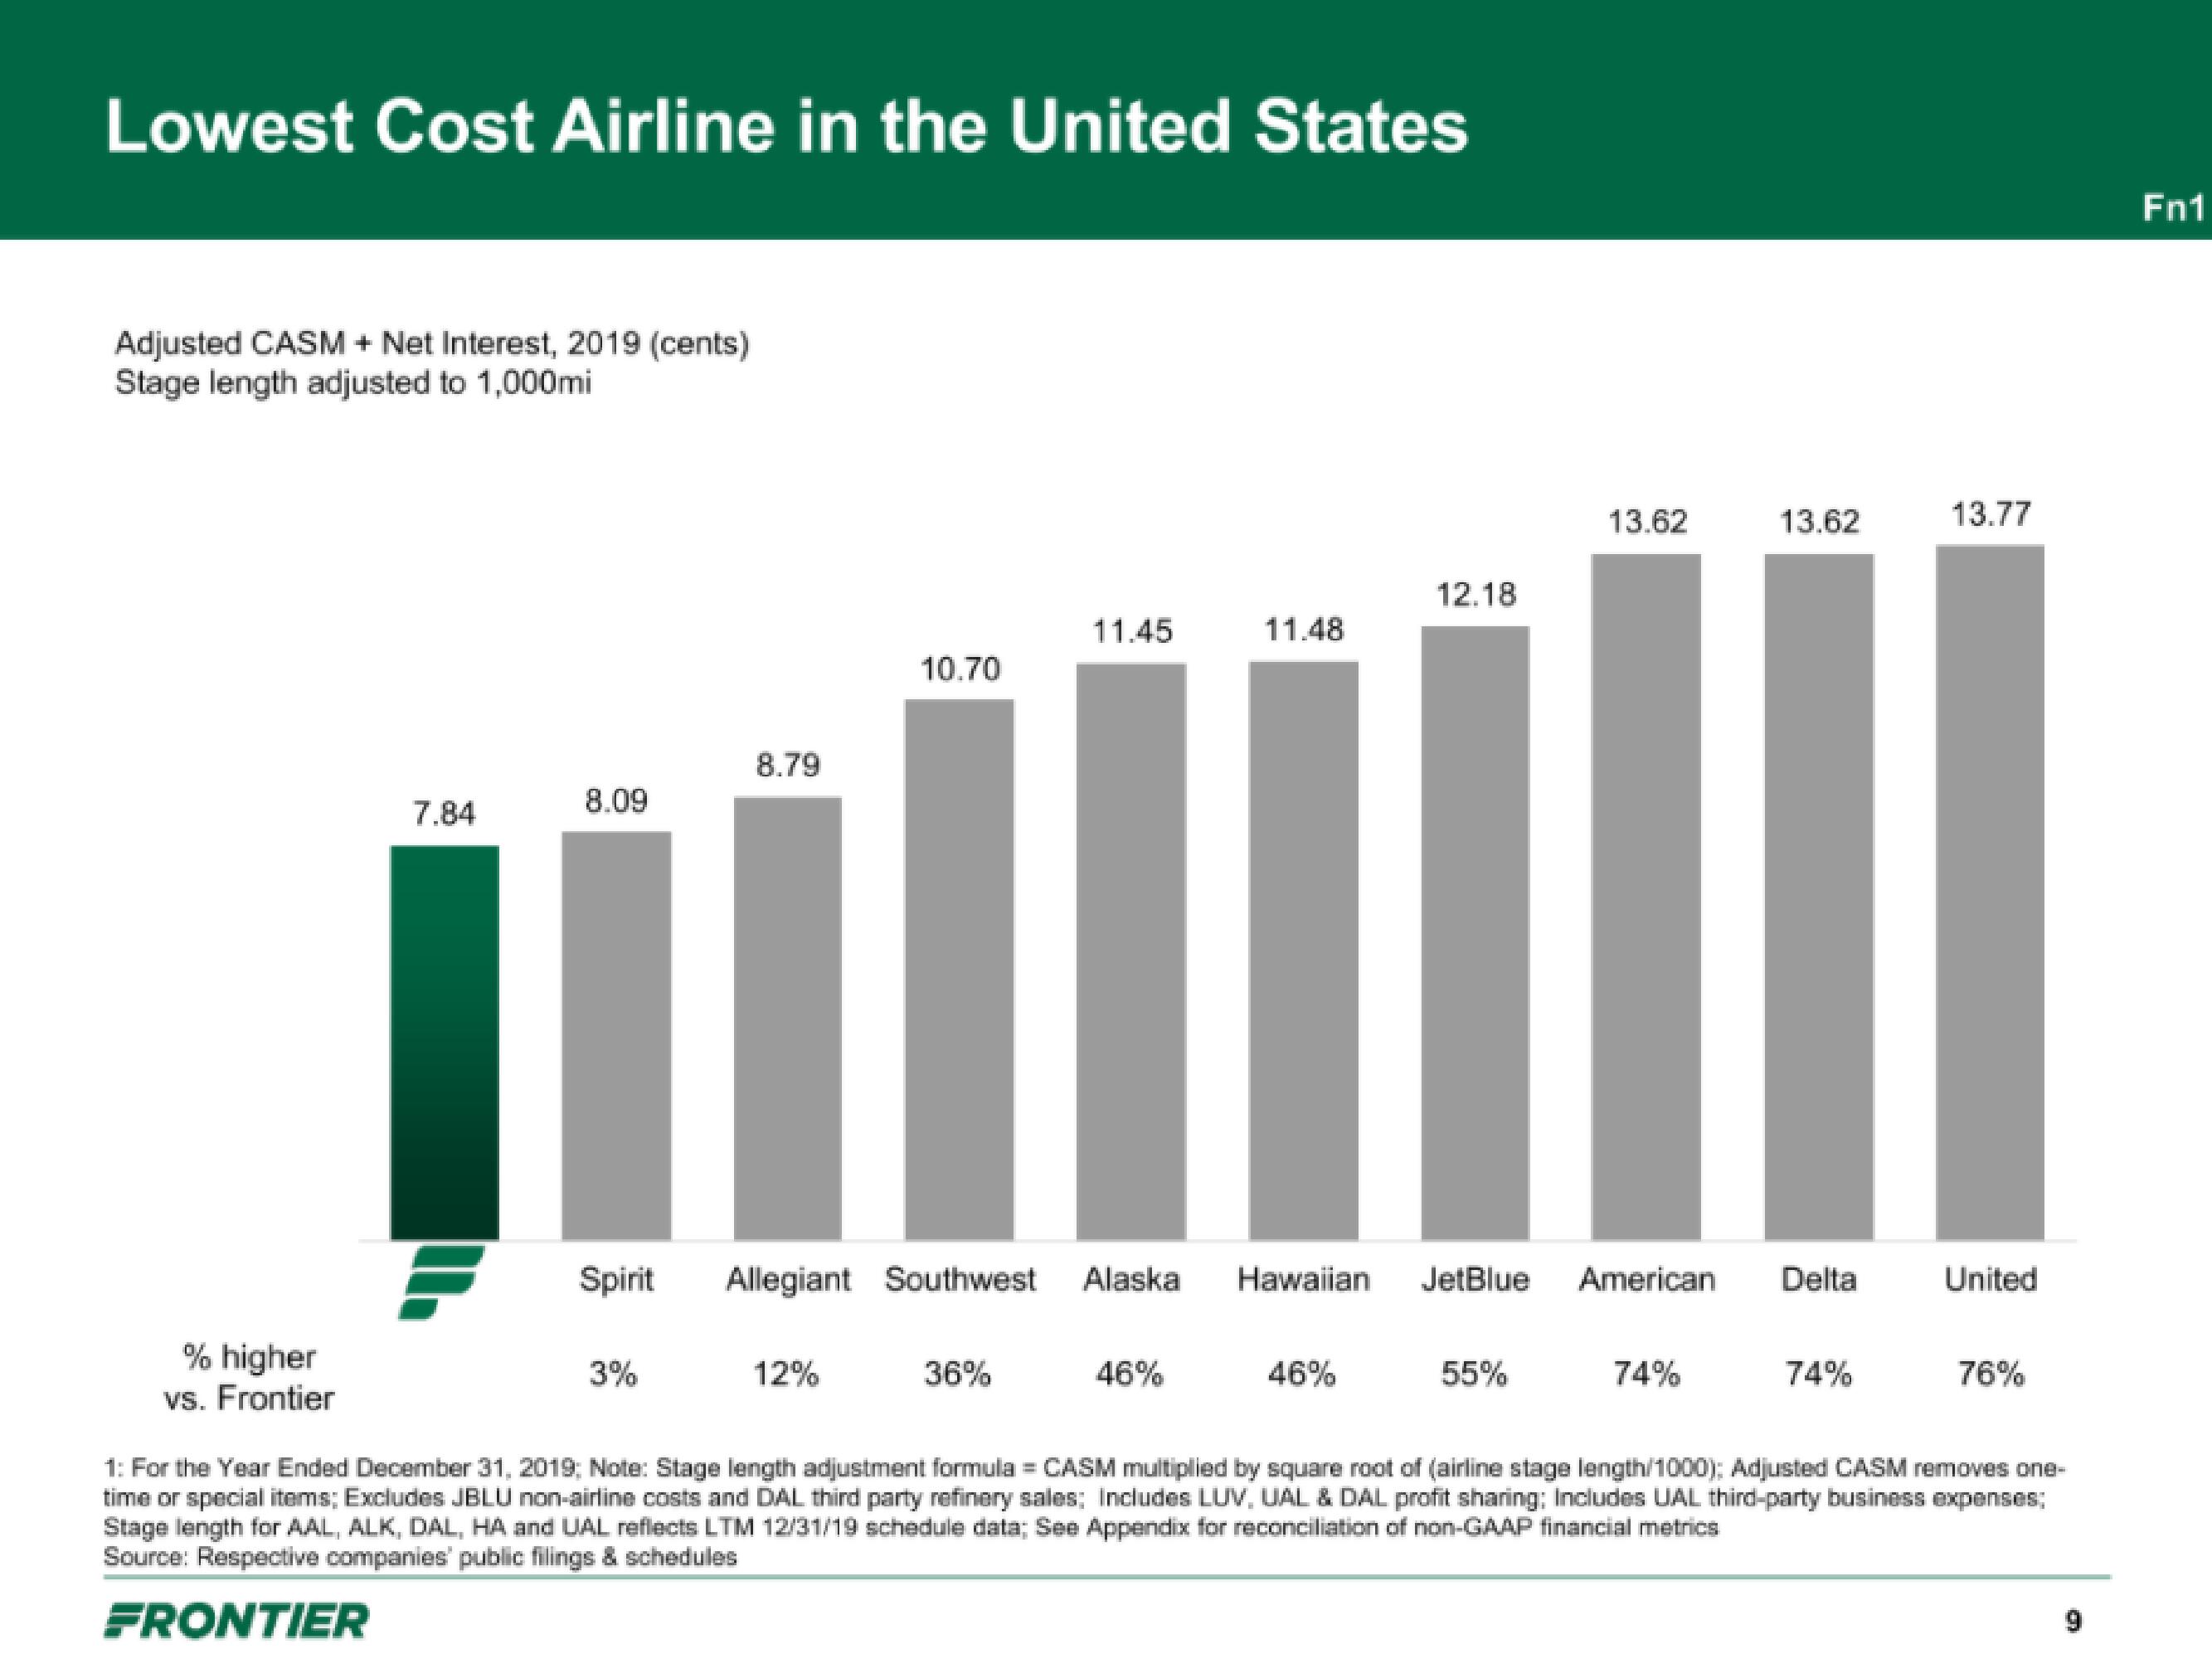
Lowest Cost Airline in the United States
Adjusted CASM + Net Interest, 2019 (cents)
Stage length adjusted to 1,000mi
% higher
vs. Frontier
7.84
8.09
Spirit
3%
8.79
10.70
12%
11.45
36%
11.48
46%
Allegiant Southwest Alaska Hawaiian JetBlue American Delta
12.18
46%
13.62
55%
13.62
74%
74%
13.77
United
76%
1: For the Year Ended December 31, 2019; Note: Stage length adjustment formula = CASM multiplied by square root of (airline stage length/1000): Adjusted CASM removes one-
time or special items; Excludes JBLU non-airline costs and DAL third party refinery sales; Includes LUV, UAL & DAL profit sharing; Includes UAL third-party business expenses;
Stage length for AAL, ALK, DAL, HA and UAL reflects LTM 12/31/19 schedule data; See Appendix for reconciliation of non-GAAP financial metrics
Source: Respective companies' public filings & schedules
FRONTIER
Fn1View entire presentation