Grove SPAC Presentation Deck
Penetration (1)
Notes:
I.
2.
3.
4.
5.
1.20-1.60%
1.00-1.19%
.90-.99%
.80-.89%
.70-.79%
.60-.69%
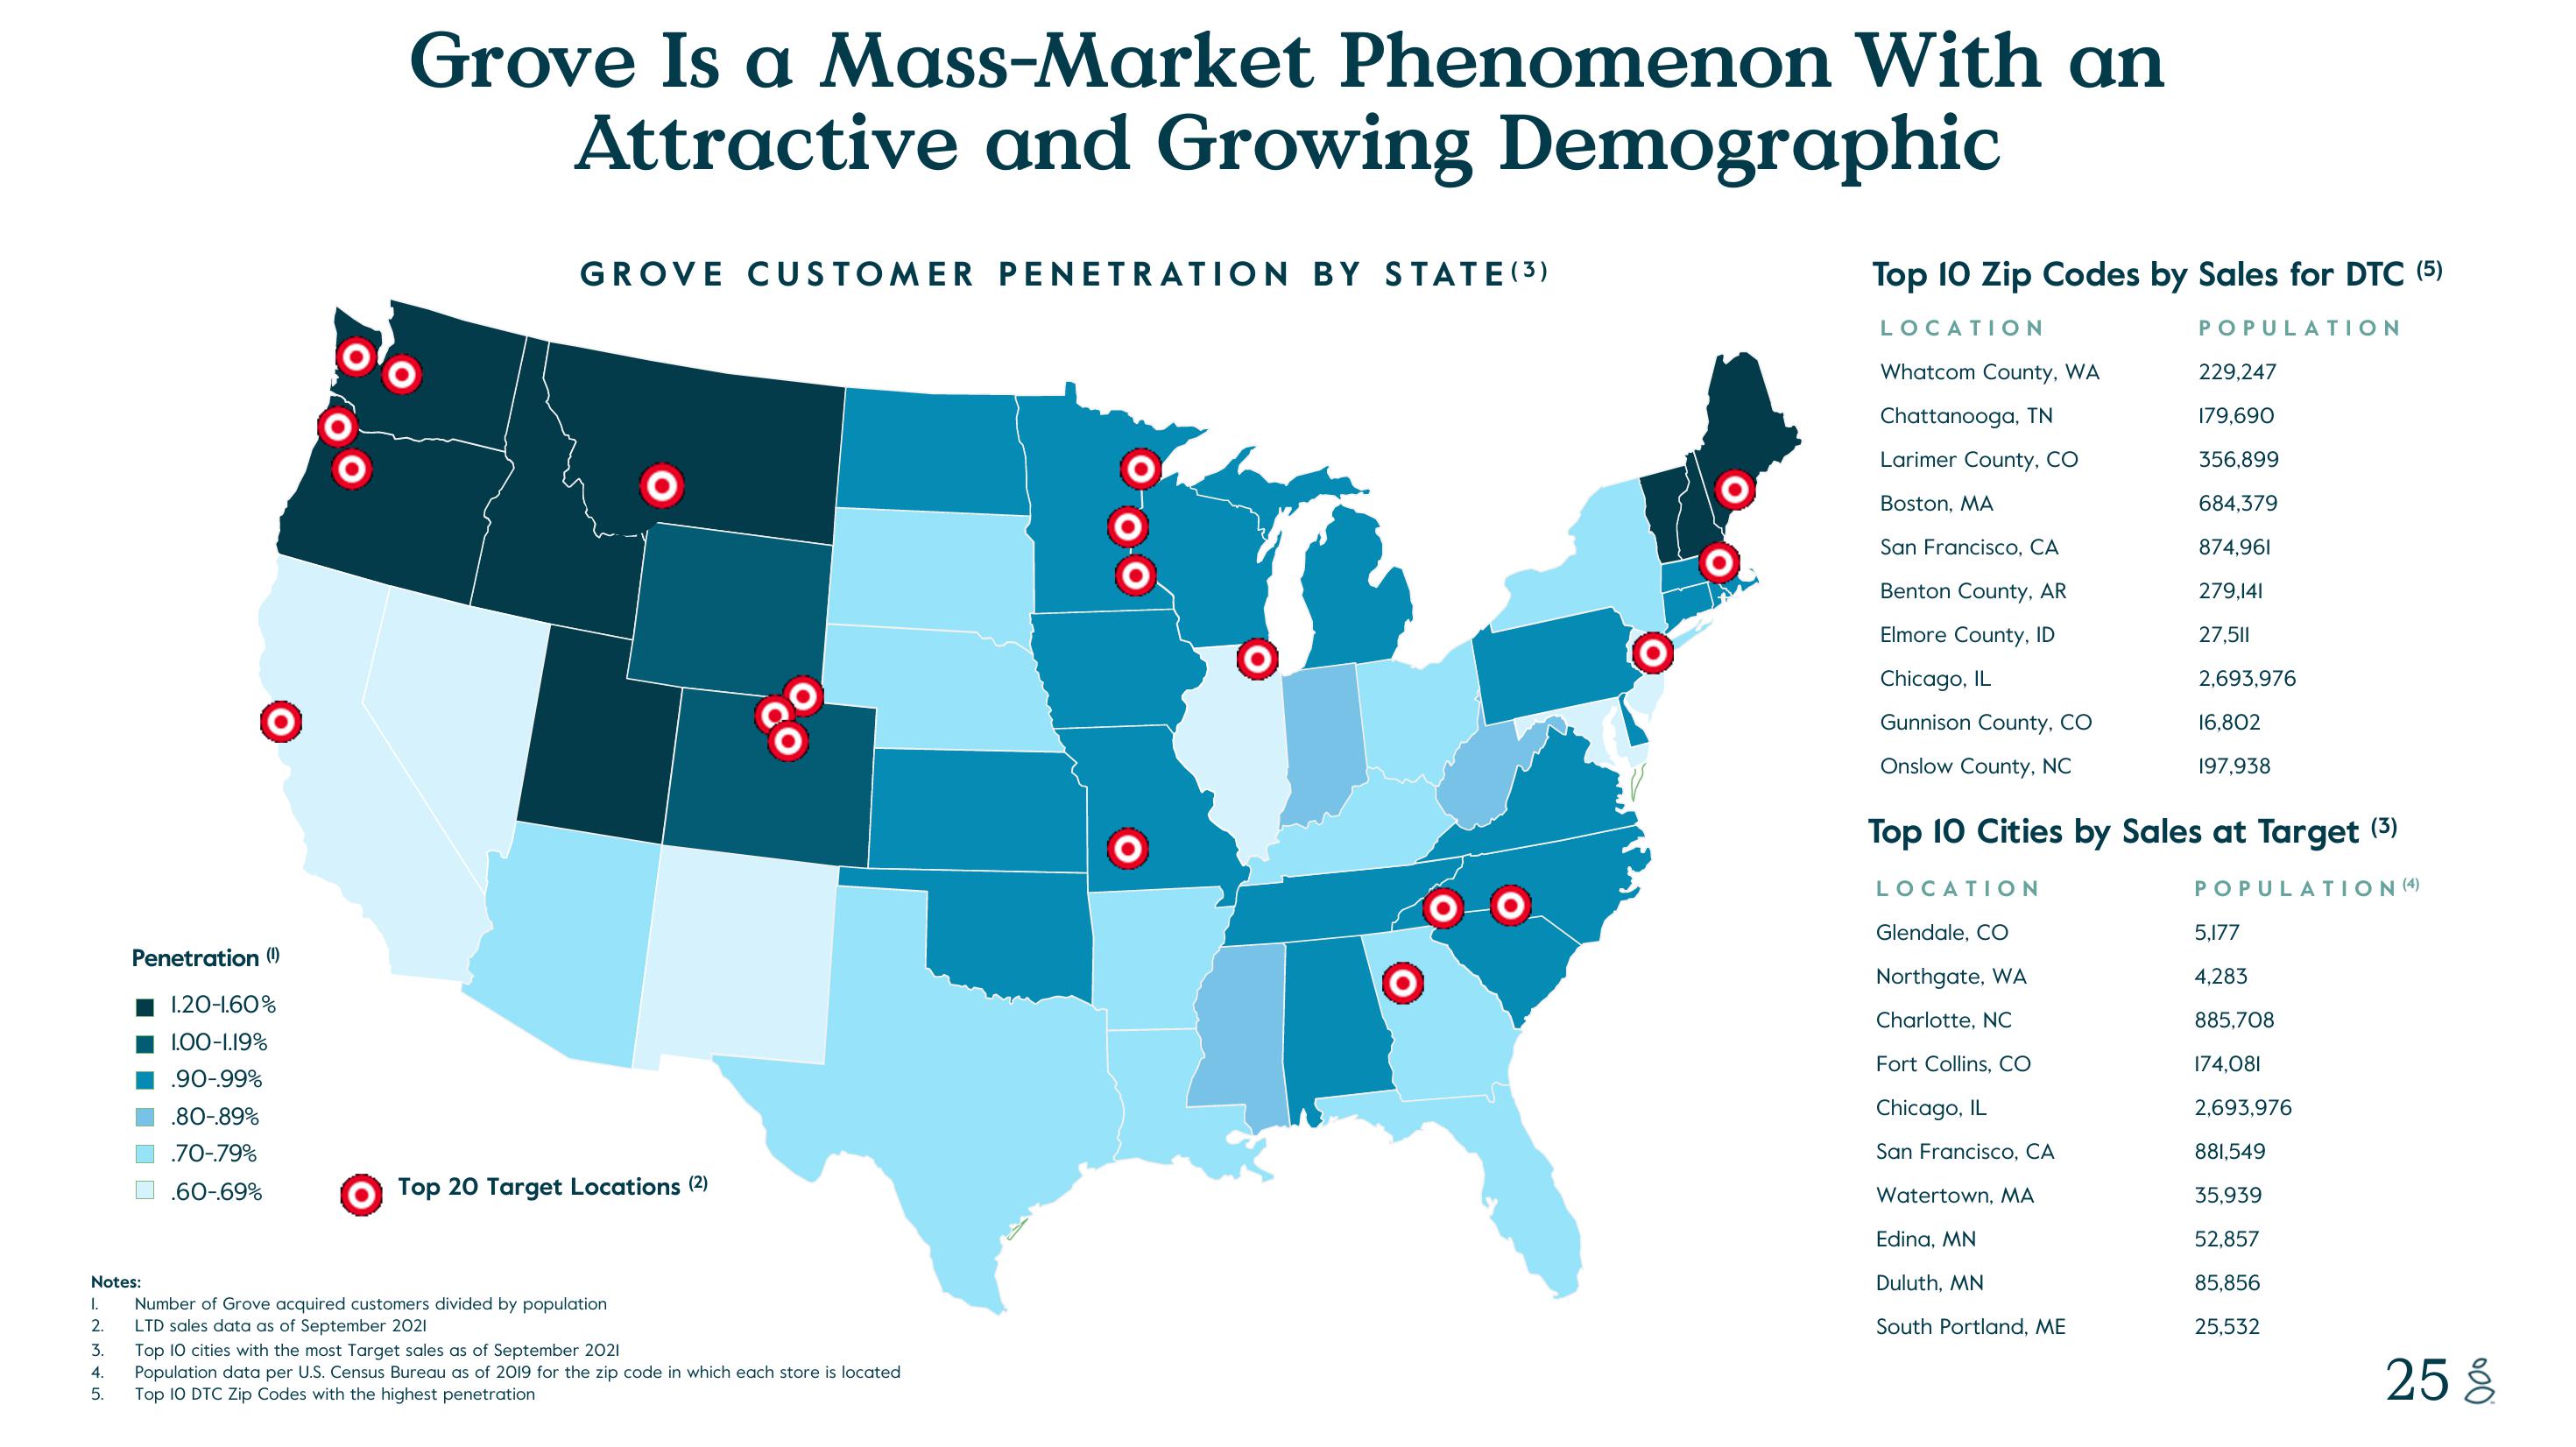
Grove Is a Mass-Market Phenomenon With an
Attractive and Growing Demographic
GROVE CUSTOMER PENETRATION BY STATE (3)
Top 20 Target Locations (2)
8⁰
Number of Grove acquired customers divided by population
LTD sales data as of September 2021
Top 10 cities with the most Target sales as of September 2021
Population data per U.S. Census Bureau as of 2019 for the zip code in which each store is located
Top 10 DTC Zip Codes with the highest penetration
Top 10 Zip Codes by Sales for DTC (5)
LOCATION
POPULATION
Whatcom County, WA
Chattanooga, TN
Larimer County, CO
Boston, MA
San Francisco, CA
Benton County, AR
Elmore County, ID
Chicago, IL
Gunnison County, CO
Onslow County, NC
Top 10 Cities by Sales at Target (3)
POPULATION (4)
LOCATION
Glendale, CO
Northgate, WA
Charlotte, NC
Fort Collins, CO
Chicago, IL
San Francisco, CA
Watertown, MA
229,247
179,690
356,899
684,379
874,961
279,141
27,511
2,693,976
16,802
197,938
Edina, MN
Duluth, MN
South Portland, ME
5,177
4,283
885,708
174,081
2,693,976
881,549
35,939
52,857
85,856
25,532
25 %View entire presentation