Pershing Square Activist Presentation Deck
C. McOpCo Financial Analysis
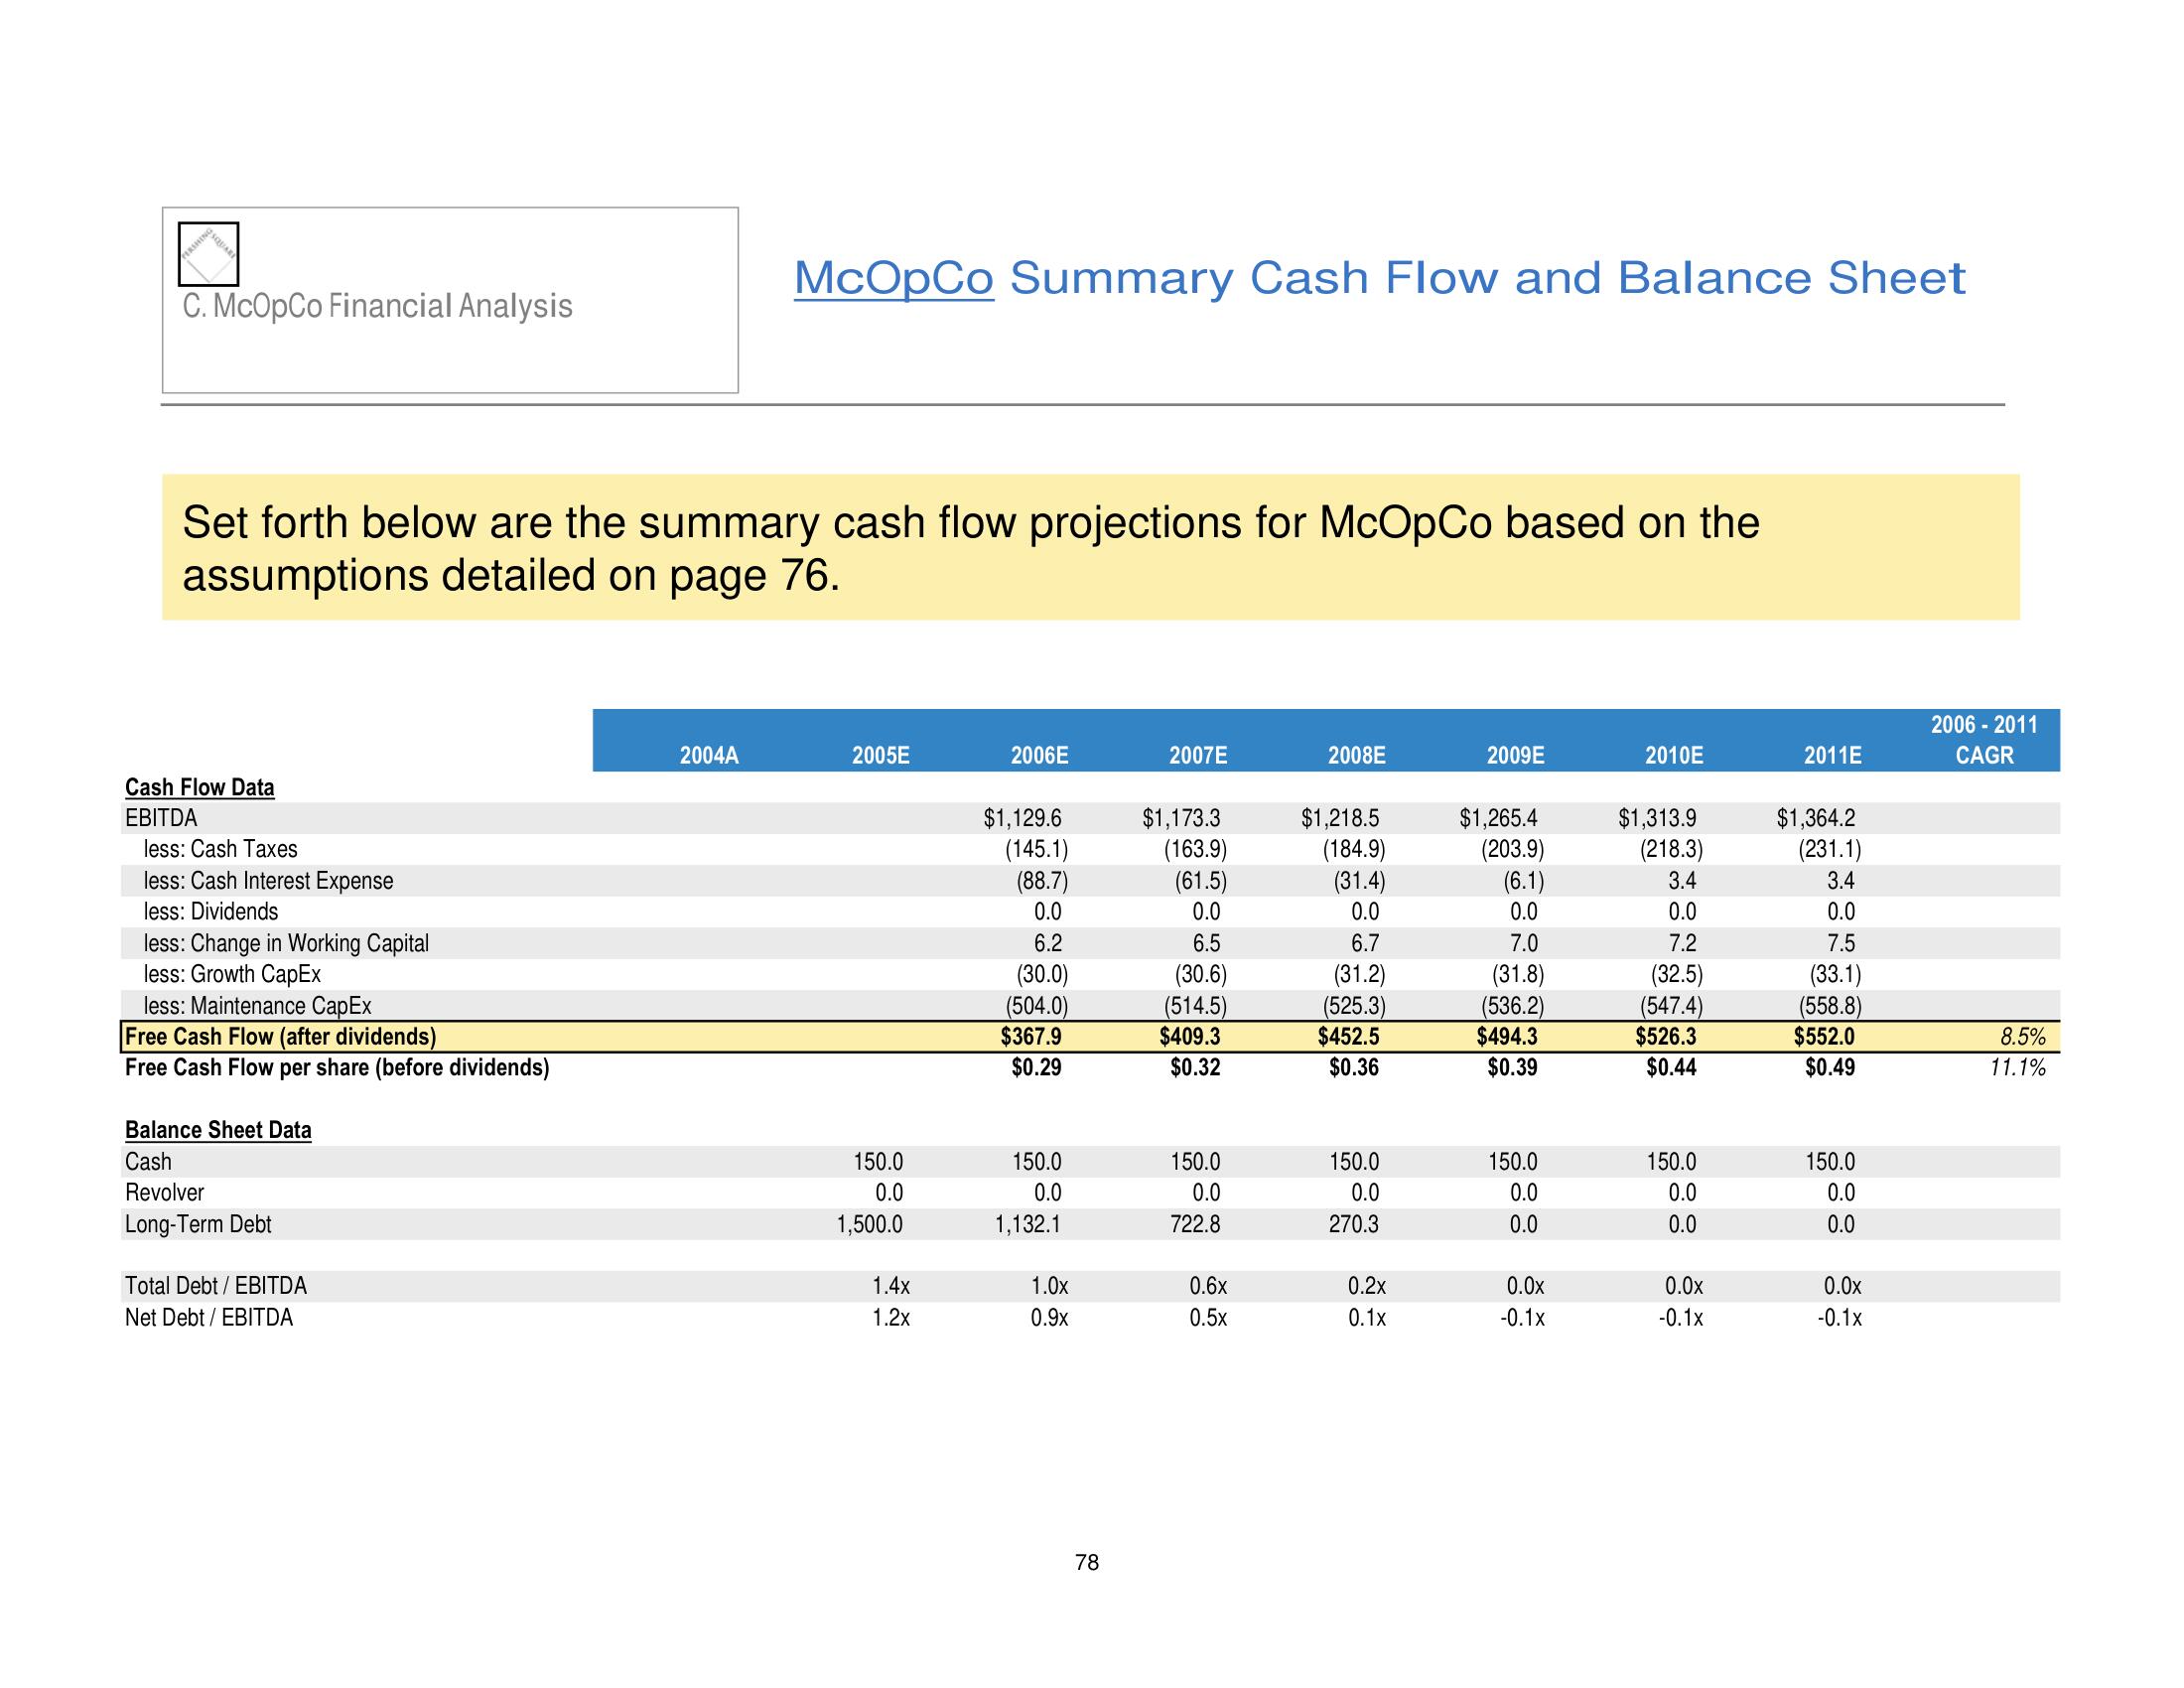
Set forth below are the summary cash flow projections for McOpCo based on the
assumptions detailed on page 76.
Cash Flow Data
EBITDA
less: Cash Taxes
less: Cash Interest Expense
less: Dividends
less: Change in Working Capital
less: Growth CapEx
less: Maintenance CapEx
Free Cash Flow (after dividends)
Free Cash Flow per share (before dividends)
Balance Sheet Data
Cash
Revolver
Long-Term Debt
Total Debt / EBITDA
Net Debt / EBITDA
McOpCo Summary Cash Flow and Balance Sheet
2004A
2005E
150.0
0.0
1,500.0
1.4x
1.2x
2006E
$1,129.6
(145.1)
(88.7)
0.0
6.2
(30.0)
(504.0)
$367.9
$0.29
150.0
0.0
1,132.1
1.0x
0.9x
78
2007E
$1,173.3
(163.9)
(61.5)
0.0
6.5
(30.6)
(514.5)
$409.3
$0.32
150.0
0.0
722.8
0.6x
0.5x
2008E
$1,218.5
(184.9)
(31.4)
0.0
6.7
(31.2)
(525.3)
$452.5
$0.36
150.0
0.0
270.3
0.2x
0.1x
2009E
$1,265.4
(203.9)
(6.1)
0.0
7.0
(31.8)
(536.2)
$494.3
$0.39
150.0
0.0
0.0
0.0x
-0.1x
2010E
$1,313.9
(218.3)
3.4
0.0
7.2
(32.5)
(547.4)
$526.3
$0.44
150.0
0.0
0.0
0.0x
-0.1x
2011E
$1,364.2
(231.1)
3.4
0.0
7.5
(33.1)
(558.8)
$552.0
$0.49
150.0
0.0
0.0
0.0x
-0.1x
2006 - 2011
CAGR
8.5%
11.1%View entire presentation