Telia Company Results Presentation Deck
SERVICE REVENUES
12
18.7
●
Q3 20
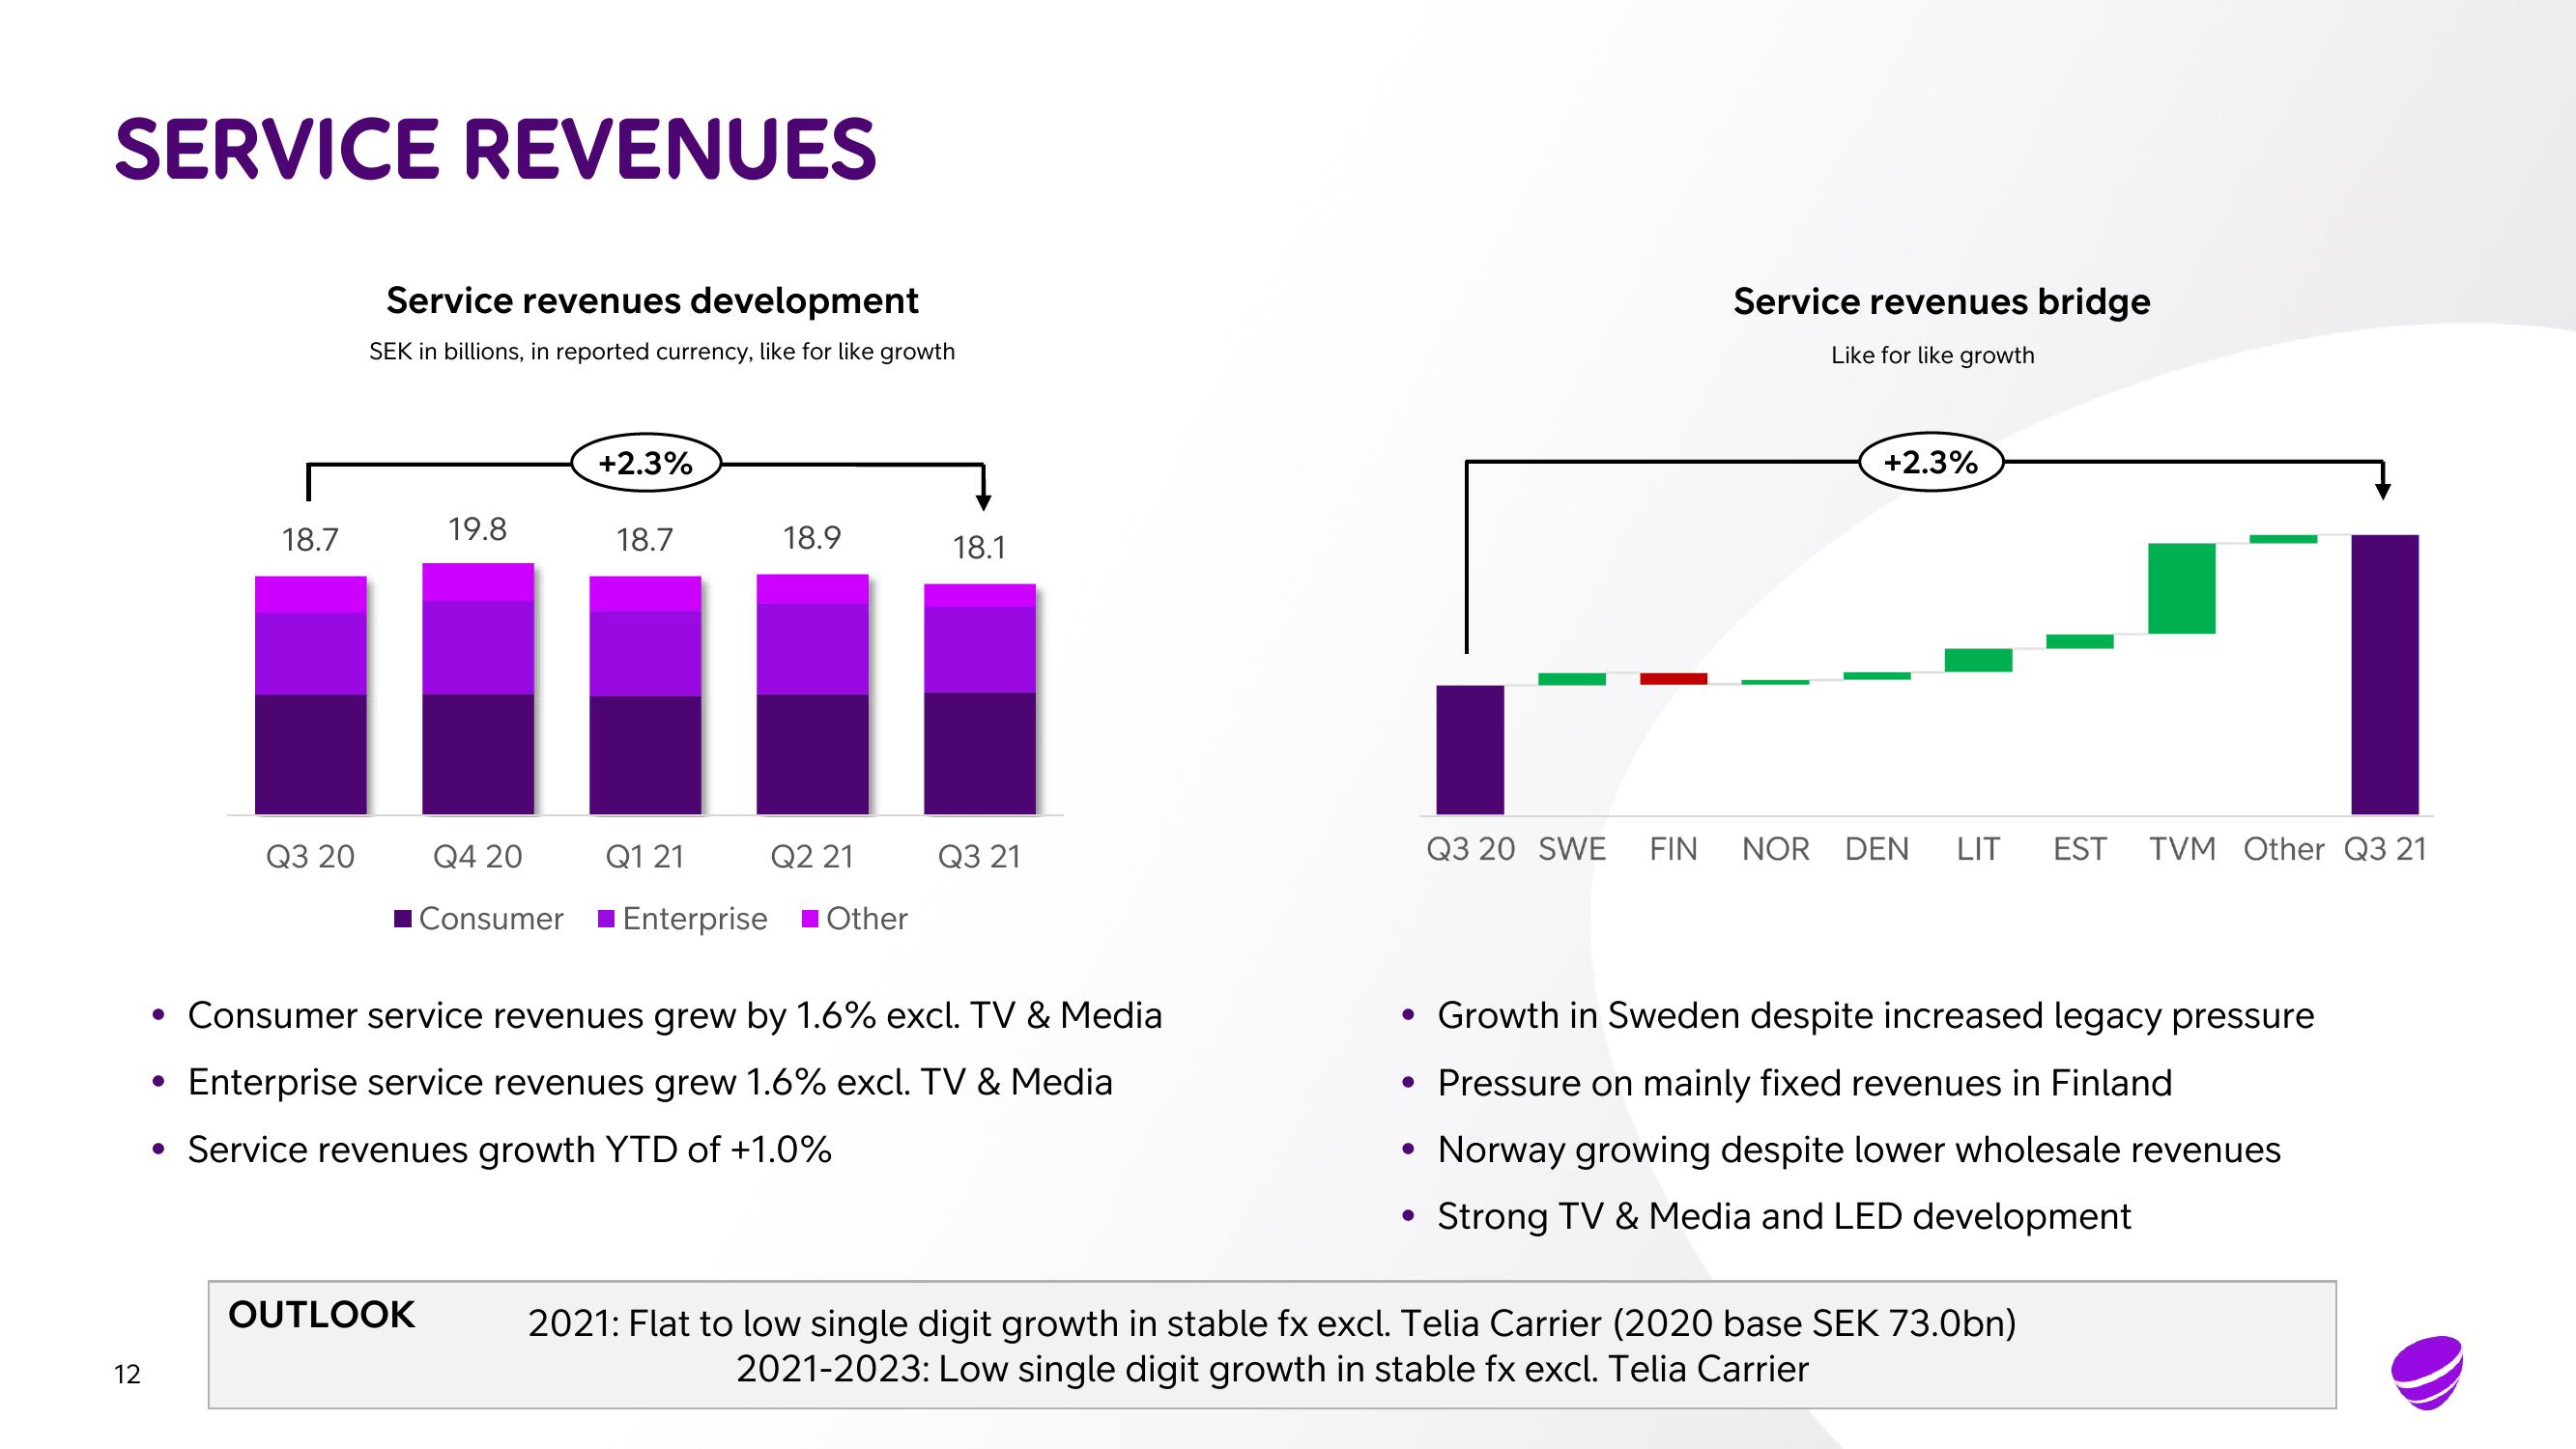
Service revenues development
SEK in billions, in reported currency, like for like growth
19.8
Q4 20
■Consumer
OUTLOOK
+2.3%
18.7
18.9
Q1 21 Q2 21
Enterprise Other
18.1
• Consumer service revenues grew by 1.6% excl. TV & Media
Enterprise service revenues grew 1.6% excl. TV & Media
• Service revenues growth YTD of +1.0%
Q3 21
●
Service revenues bridge
Like for like growth
●
+2.3%
Q3 20 SWE FIN NOR DEN
• Growth in Sweden despite increased legacy pressure
• Pressure on mainly fixed revenues in Finland
Norway growing despite lower wholesale revenues
Strong TV & Media and LED development
LIT EST TVM Other Q3 21
2021: Flat to low single digit growth in stable fx excl. Telia Carrier (2020 base SEK 73.0bn)
2021-2023: Low single digit growth in stable fx excl. Telia CarrierView entire presentation