J.P.Morgan Investment Banking Pitch Book
PRELIMINARY VALUATION ANALYSIS
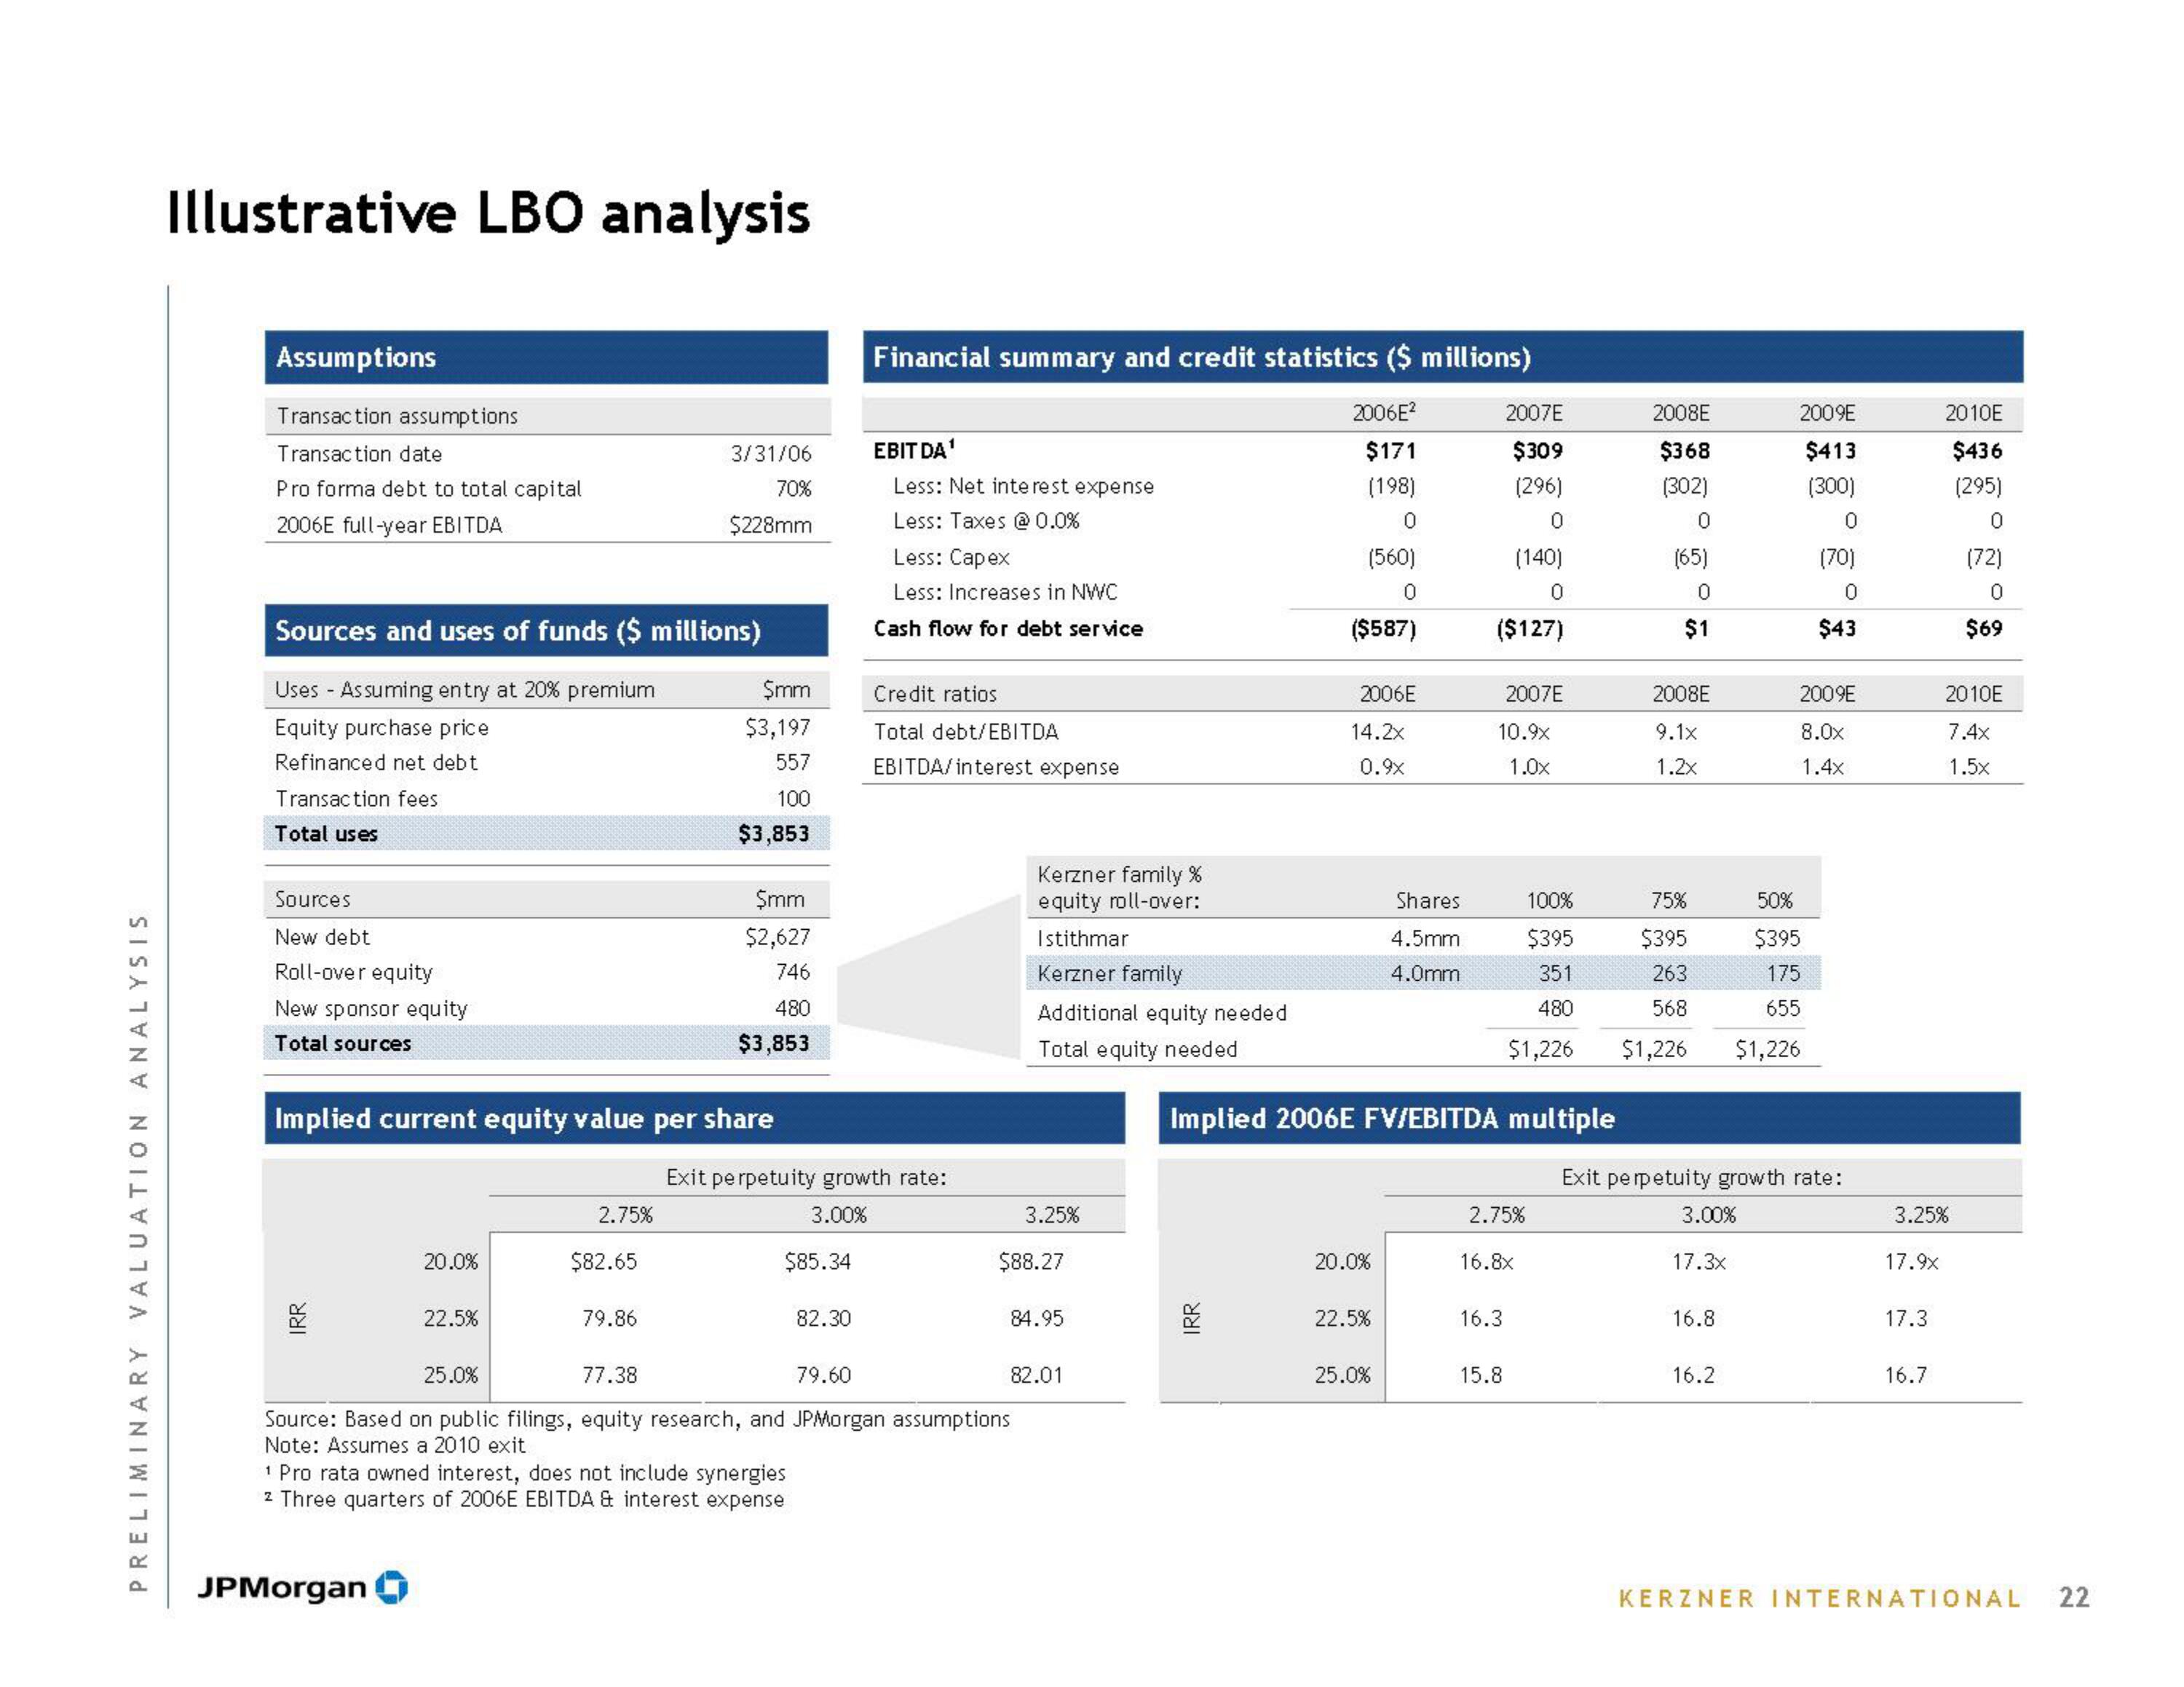
Illustrative LBO analysis
Assumptions
Transaction assumptions
Transaction date
Pro forma debt to total capital
2006E full-year EBITDA
Sources and uses of funds ($ millions)
Uses - Assuming entry at 20% premium
Equity purchase price
Refinanced net debt
Transaction fees
Total uses
Sources
New debt
Roll-over equity
New sponsor equity
Total sources
IRR
Implied current equity value per share
20.0%
22.5%
JPMorgan
2.75%
3/31/06
70%
$228mm
$82.65
79.86
$mm
$3,197
557
100
$3,853
$mm
$2,627
746
480
$3,853
$85.34
1 Pro rata owned interest, does not include synergies
z Three quarters of 2006E EBITDA & interest expense
Financial summary and credit statistics ($ millions)
2006E²
$171
(198)
0
82.30
EBITDA¹
Less: Net interest expense
Less: Taxes @ 0.0%
Less: Capex
Less: Increases in NWC
Cash flow for debt service
Exit perpetuity growth rate:
3.00%
Credit ratios
Total debt/EBITDA
EBITDA/interest expense
25.0%
77.38
79.60
Source: Based on public filings, equity research, and JPMorgan assumptions
Note: Assumes a 2010 exit
Kerzner family %
equity roll-over:
Istithmar
Kerzner family
Additional equity needed
Total equity needed
3.25%
$88.27
84.95
82.01
(560)
0
($587)
IRR
2006E
14.2x
0.9x
20.0%
22.5%
Shares
4.5mm
4.0mm
25.0%
2007E
$309
(296)
0
(140)
0
($127)
Implied 2006E FV/EBITDA multiple
10.9x
1.0x
2007E
2.75%
16.3
16.8x
15.8
2008E
$368
(302)
0
(65)
0
$1
2008E
9.1x
1.2x
100%
75%
50%
$395
$395
$395
351
263
175
480
568
655
$1,226 $1,226 $1,226
3.00%
17.3x
2009E
$413
(300)
0
Exit perpetuity growth rate:
16.8
16.2
(70)
0
$43
2009E
8.0x
1.4x
17.9x
3.25%
17.3
2010E
$436
(295)
0
(72)
0
$69
16.7
2010E
7.4x
1.5x
KERZNER INTERNATIONAL 22View entire presentation