Main Street Capital Investor Presentation Deck
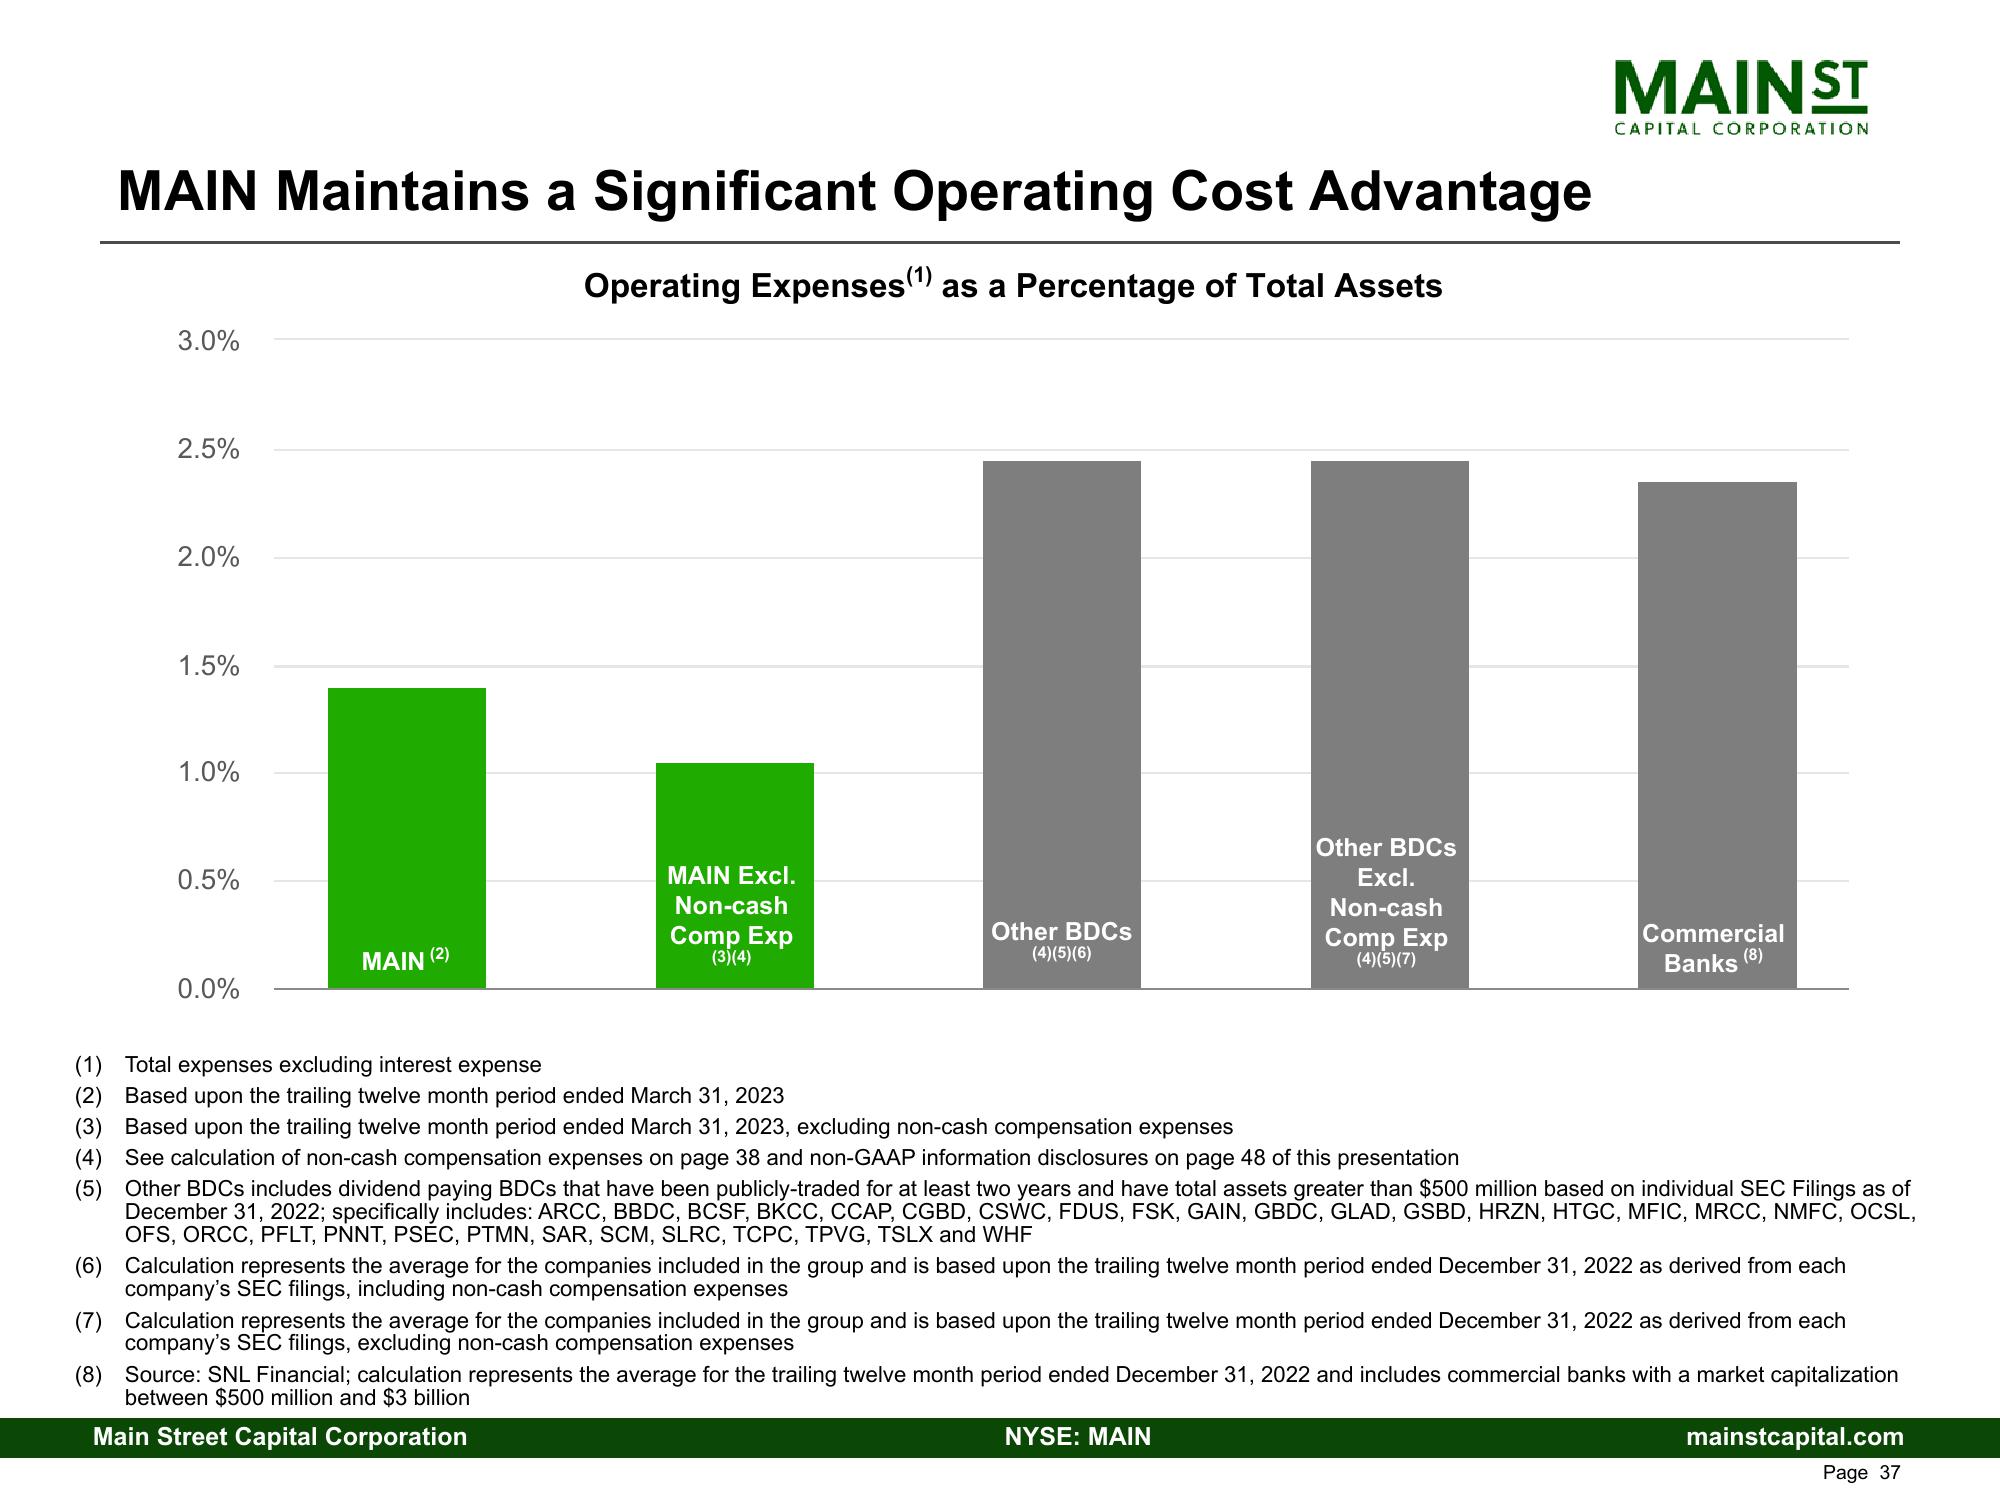
MAIN Maintains a Significant Operating Cost Advantage
Operating Expenses (¹) as a Percentage of Total Assets
3.0%
2.5%
2.0%
1.5%
1.0%
0.5%
0.0%
MAIN (2)
MAIN Excl.
Non-cash
Comp Exp
(3)(4)
Other BDCs
(4)(5)(6)
Other BDCS
Excl.
Non-cash
Comp Exp
(4)(5)(7)
MAIN ST
CAPITAL CORPORATION
1
Commercial
Banks (8)
(1) Total expenses excluding interest expense
(2) Based upon the trailing twelve month period ended March 31, 2023
(3) Based upon the trailing twelve month period ended March 31, 2023, excluding non-cash compensation expenses
(4) See calculation of non-cash compensation expenses on page 38 and non-GAAP information disclosures on page 48 of this presentation
(5) Other BDCs includes dividend paying BDCs that have been publicly-traded for at least two years and have total assets greater than $500 million based on individual SEC Filings as of
December 31, 2022; specifically includes: ARCC, BBDC, BCSF, BKCC, CCAP, CGBD, CSWC, FDUS, FSK, GAIN, GBDC, GLAD, GSBD, HRZN, HTGC, MFIC, MRCC, NMFC, OCSL,
OFS, ORCC, PFLT, PNNT, PSÉC, PTMN, SAR, SCM, SLRC, TCPC, TPVG, TSLX and WHF
NYSE: MAIN
(6) Calculation represents the average for the companies included in the group and is based upon the trailing twelve month period ended December 31, 2022 as derived from each
company's SEC filings, including non-cash compensation expenses
(7) Calculation represents the average for the companies included in the group and is based upon the trailing twelve month period ended December 31, 2022 as derived from each
company's SEC filings, excluding non-cash compensation expenses
(8)
Source: SNL Financial; calculation represents the average for the trailing twelve month period ended December 31, 2022 and includes commercial banks with a market capitalization
between $500 million and $3 billion
Main Street Capital Corporation
mainstcapital.com
Page 37View entire presentation