Grab SPAC Presentation Deck
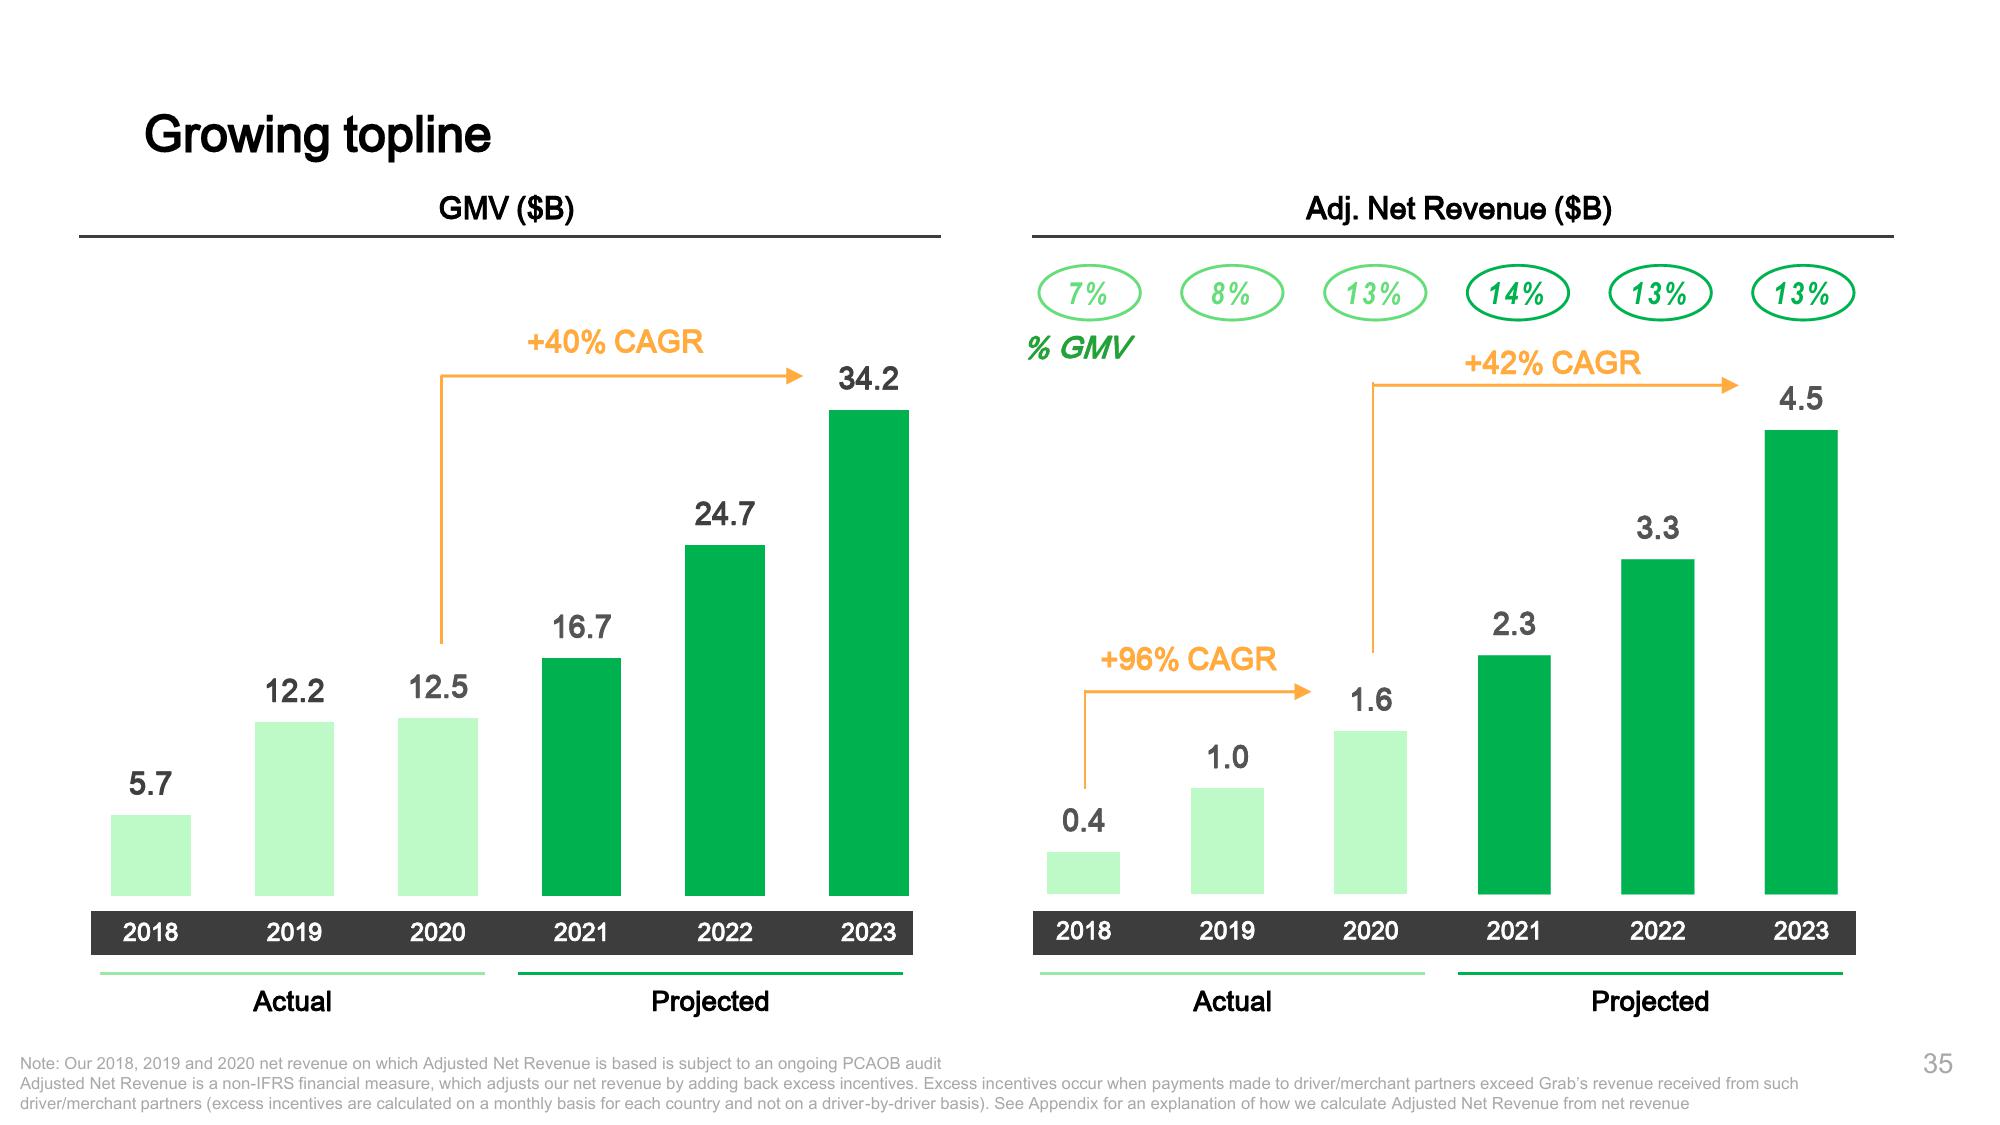
Growing topline
5.7
2018
12.2
2019
Actual
GMV ($B)
12.5
2020
+40% CAGR
16.7
2021
24.7
2022
34.2
2023
7%
% GMV
+96% CAGR
0.4
8%
2018
1.0
2019
Actual
Adj. Net Revenue ($B)
13%
1.6
2020
14%
+42% CAGR
2.3
13%
2021
3.3
2022
Projected
13%
4.5
Projected
Note: Our 2018, 2019 and 2020 net revenue on which Adjusted Net Revenue is based is subject to an ongoing PCAOB audit
Adjusted Net Revenue is a non-IFRS financial measure, which adjusts our net revenue by adding back excess incentives. Excess incentives occur when payments made to driver/merchant partners exceed Grab's revenue received from such
driver/merchant partners (excess incentives are calculated on a monthly basis for each country and not on a driver-by-driver basis). See Appendix for an explanation of how we calculate Adjusted Net Revenue from net revenue
2023
35View entire presentation