Goldman Sachs Investment Banking Pitch Book
Goldman
Sachs
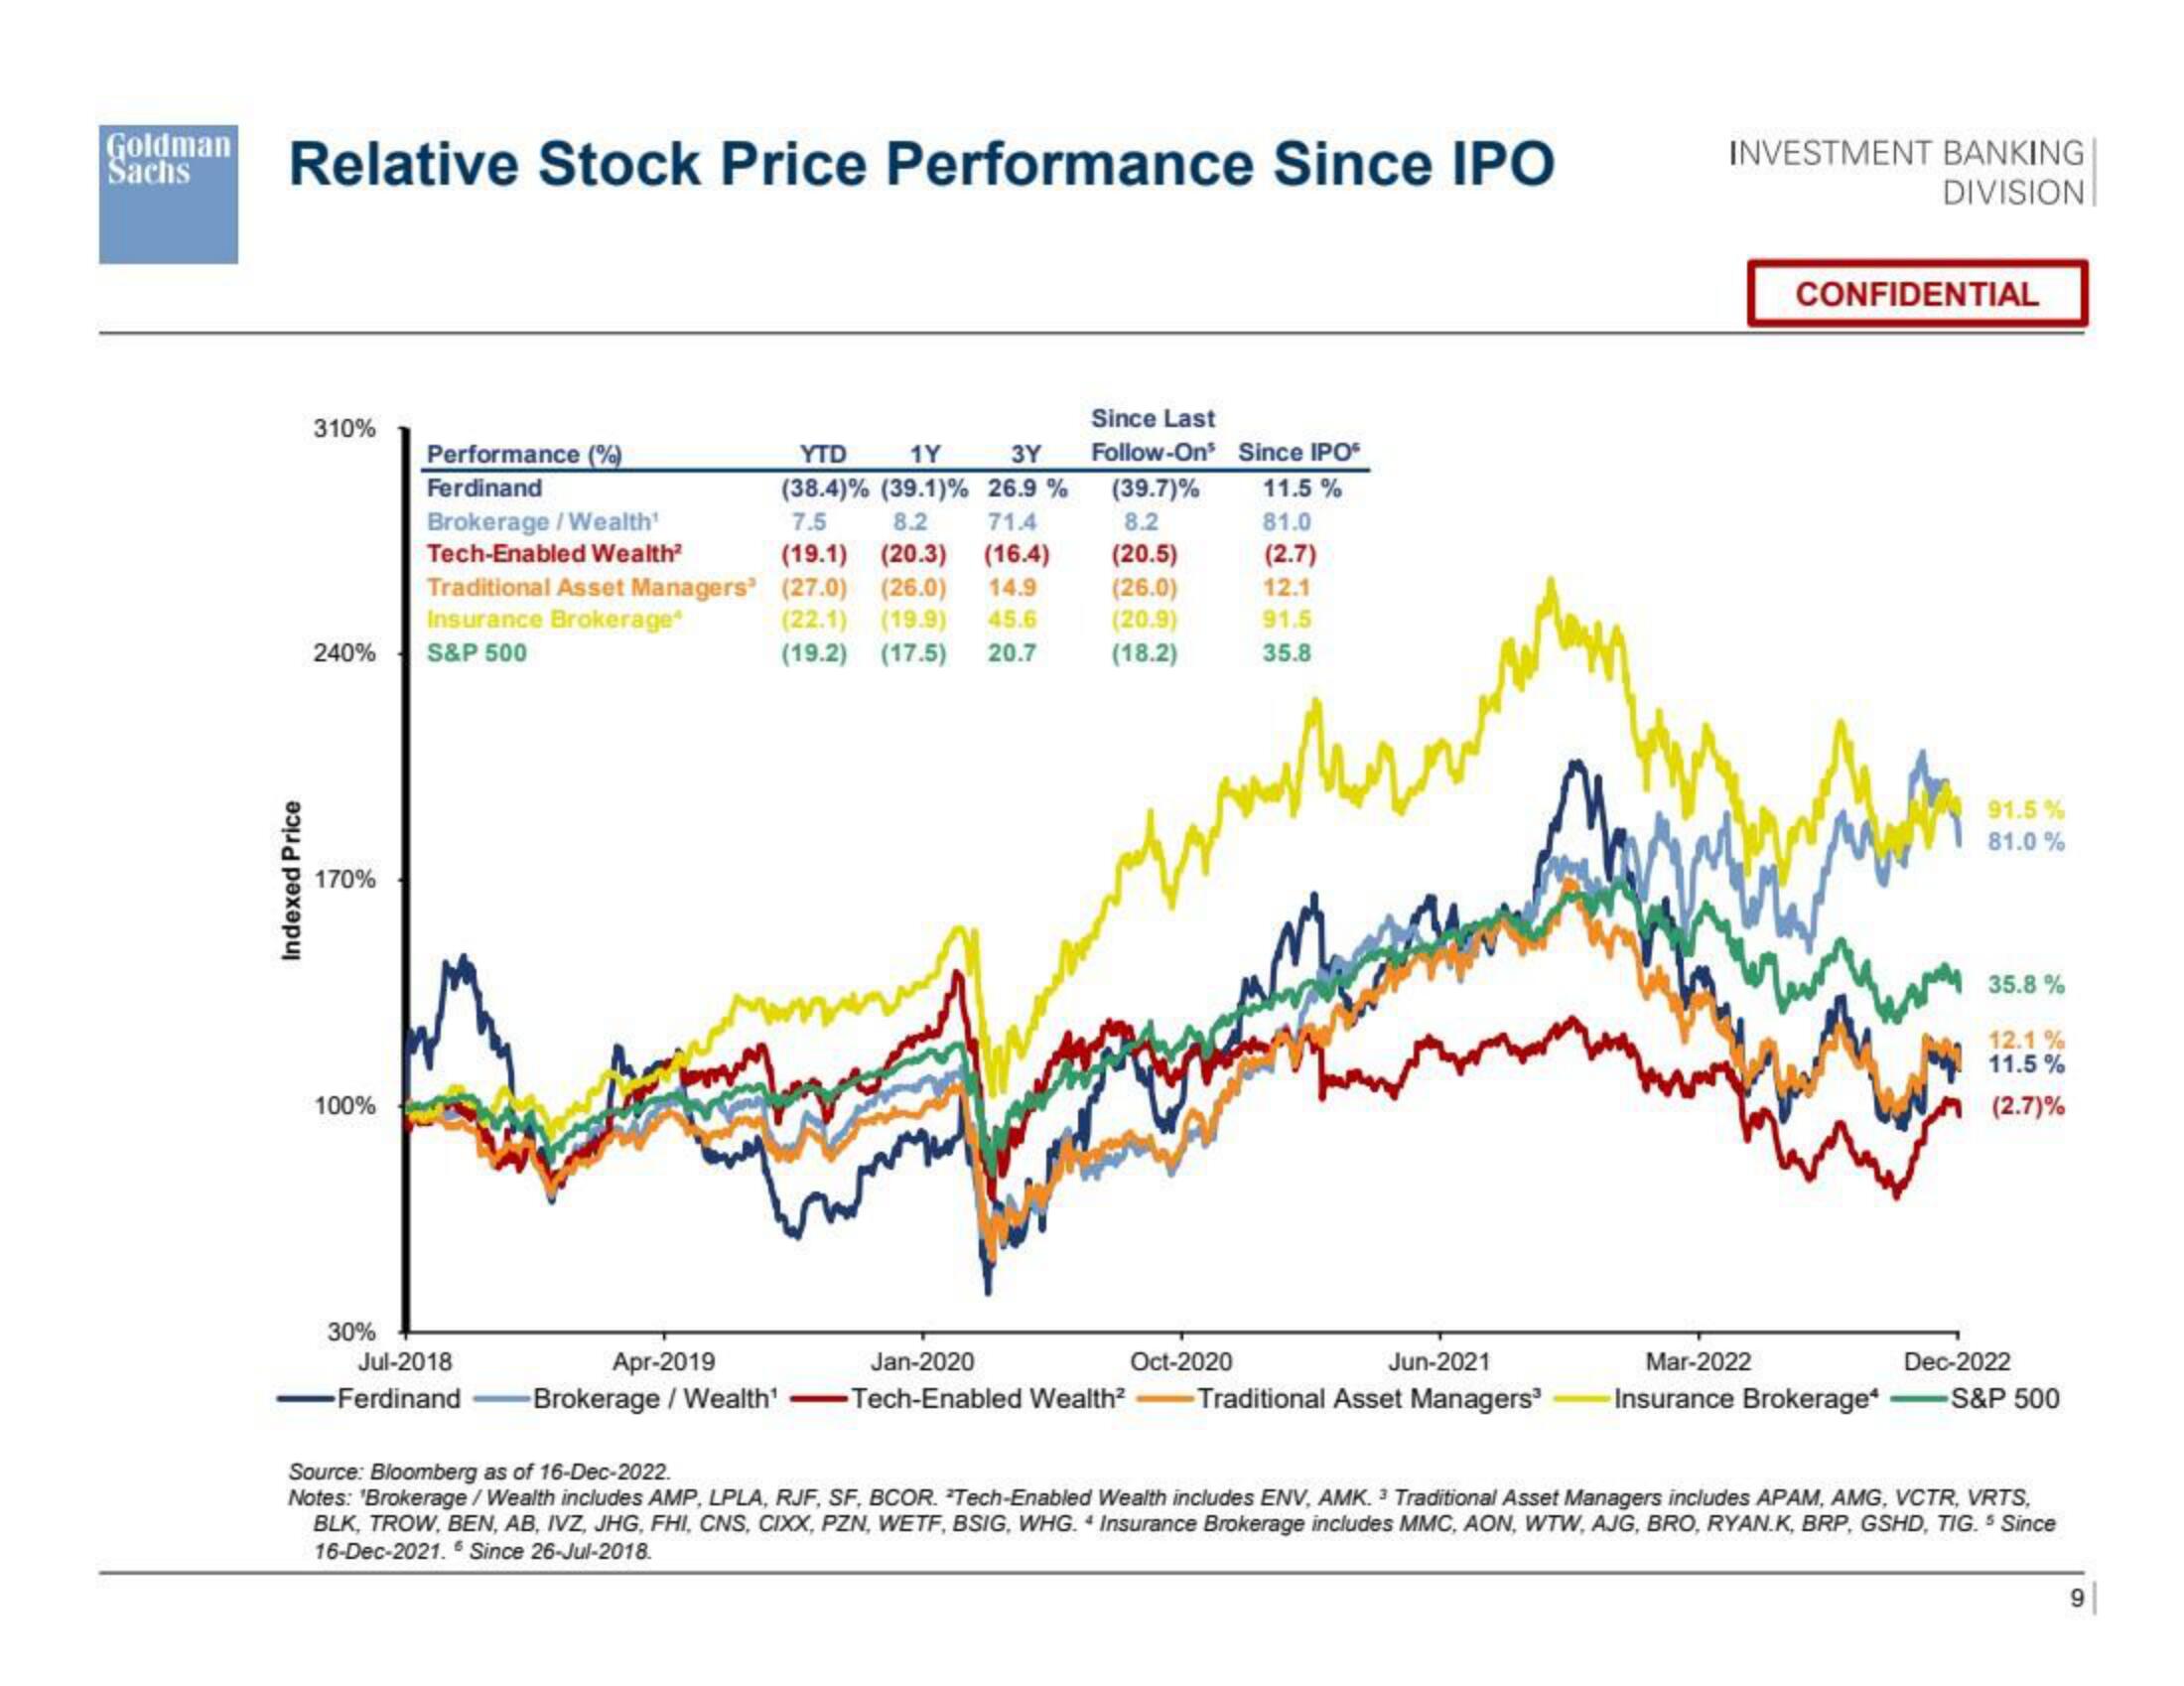
Relative Stock Price Performance Since IPO
Indexed Price
310%
240%
170%
100%
30%
Performance (%)
Ferdinand
Brokerage/Wealth¹
Tech-Enabled Wealth²
Traditional Asset Managers
Insurance Brokerage*
S&P 500
Jul-2018
-Ferdinand
YTD 1Y 3Y
(38.4) % (39.1) % 26.9%
7.5 8.2 71.4
(19.1) (20.3) (16.4)
(27.0) (26.0) 14.9
(22.1) (19.9) 45.6
(19.2) (17.5) 20.7
Since Last
Follow-On³ Since IPO
(39.7)% 11.5%
8.2
81.0
(20.5)
(2.7)
(26.0)
12.1
(20.9)
91.5
(18.2)
35.8
ار ادا کرنے
werden.
Apr-2019
Jan-2020
Oct-2020
Jun-2021
-Brokerage / Wealth¹ -Tech-Enabled Wealth²-Traditional Asset Managers³
INVESTMENT BANKING
DIVISION
CONFIDENTIAL
91.5%
81.0 %
35.8%
12.1%
11.5%
(2.7)%
Mar-2022
Dec-2022
Insurance Brokerage* -S&P 500
Source: Bloomberg as of 16-Dec-2022.
Notes: "Brokerage / Wealth includes AMP, LPLA, RJF, SF, BCOR. *Tech-Enabled Wealth includes ENV, AMK. 3 Traditional Asset Managers includes APAM, AMG, VCTR, VRTS,
BLK, TROW, BEN, AB, IVZ, JHG, FHI, CNS, CIXX, PZN, WETF, BSIG, WHG. 4 Insurance Brokerage includes MMC, AON, WTW, AJG, BRO, RYAN.K, BRP, GSHD, TIG. ³ Since
16-Dec-2021. Since 26-Jul-2018.
9View entire presentation