Paysafe Results Presentation Deck
Q3 summary of consolidated results
$ in millions
Revenue
Gross Profit (excluding D&A)
Margin %
Adjusted EBITDA
Margin %
Depreciation and amortization
Interest expense, net
Net loss (income) attributable to Paysafe
Adjusted net income¹
Adjusted EPS¹
Paysafe:
Q3 '21
$353.6
$208.7
59.0%
$106.4
30.1%
$61.8
$19.3
($147.2)
$39.4
$0.05
Q3 '22
$366.0
$214.2
58.5%
$95.5
26.1%
$66.1
$34.6
$1.0
$29.2
$0.04
Change
4%
10% CC
3%
(50bps)
(10%)
(400bps)
7%
80%
NM
(26%)
(26%)
●
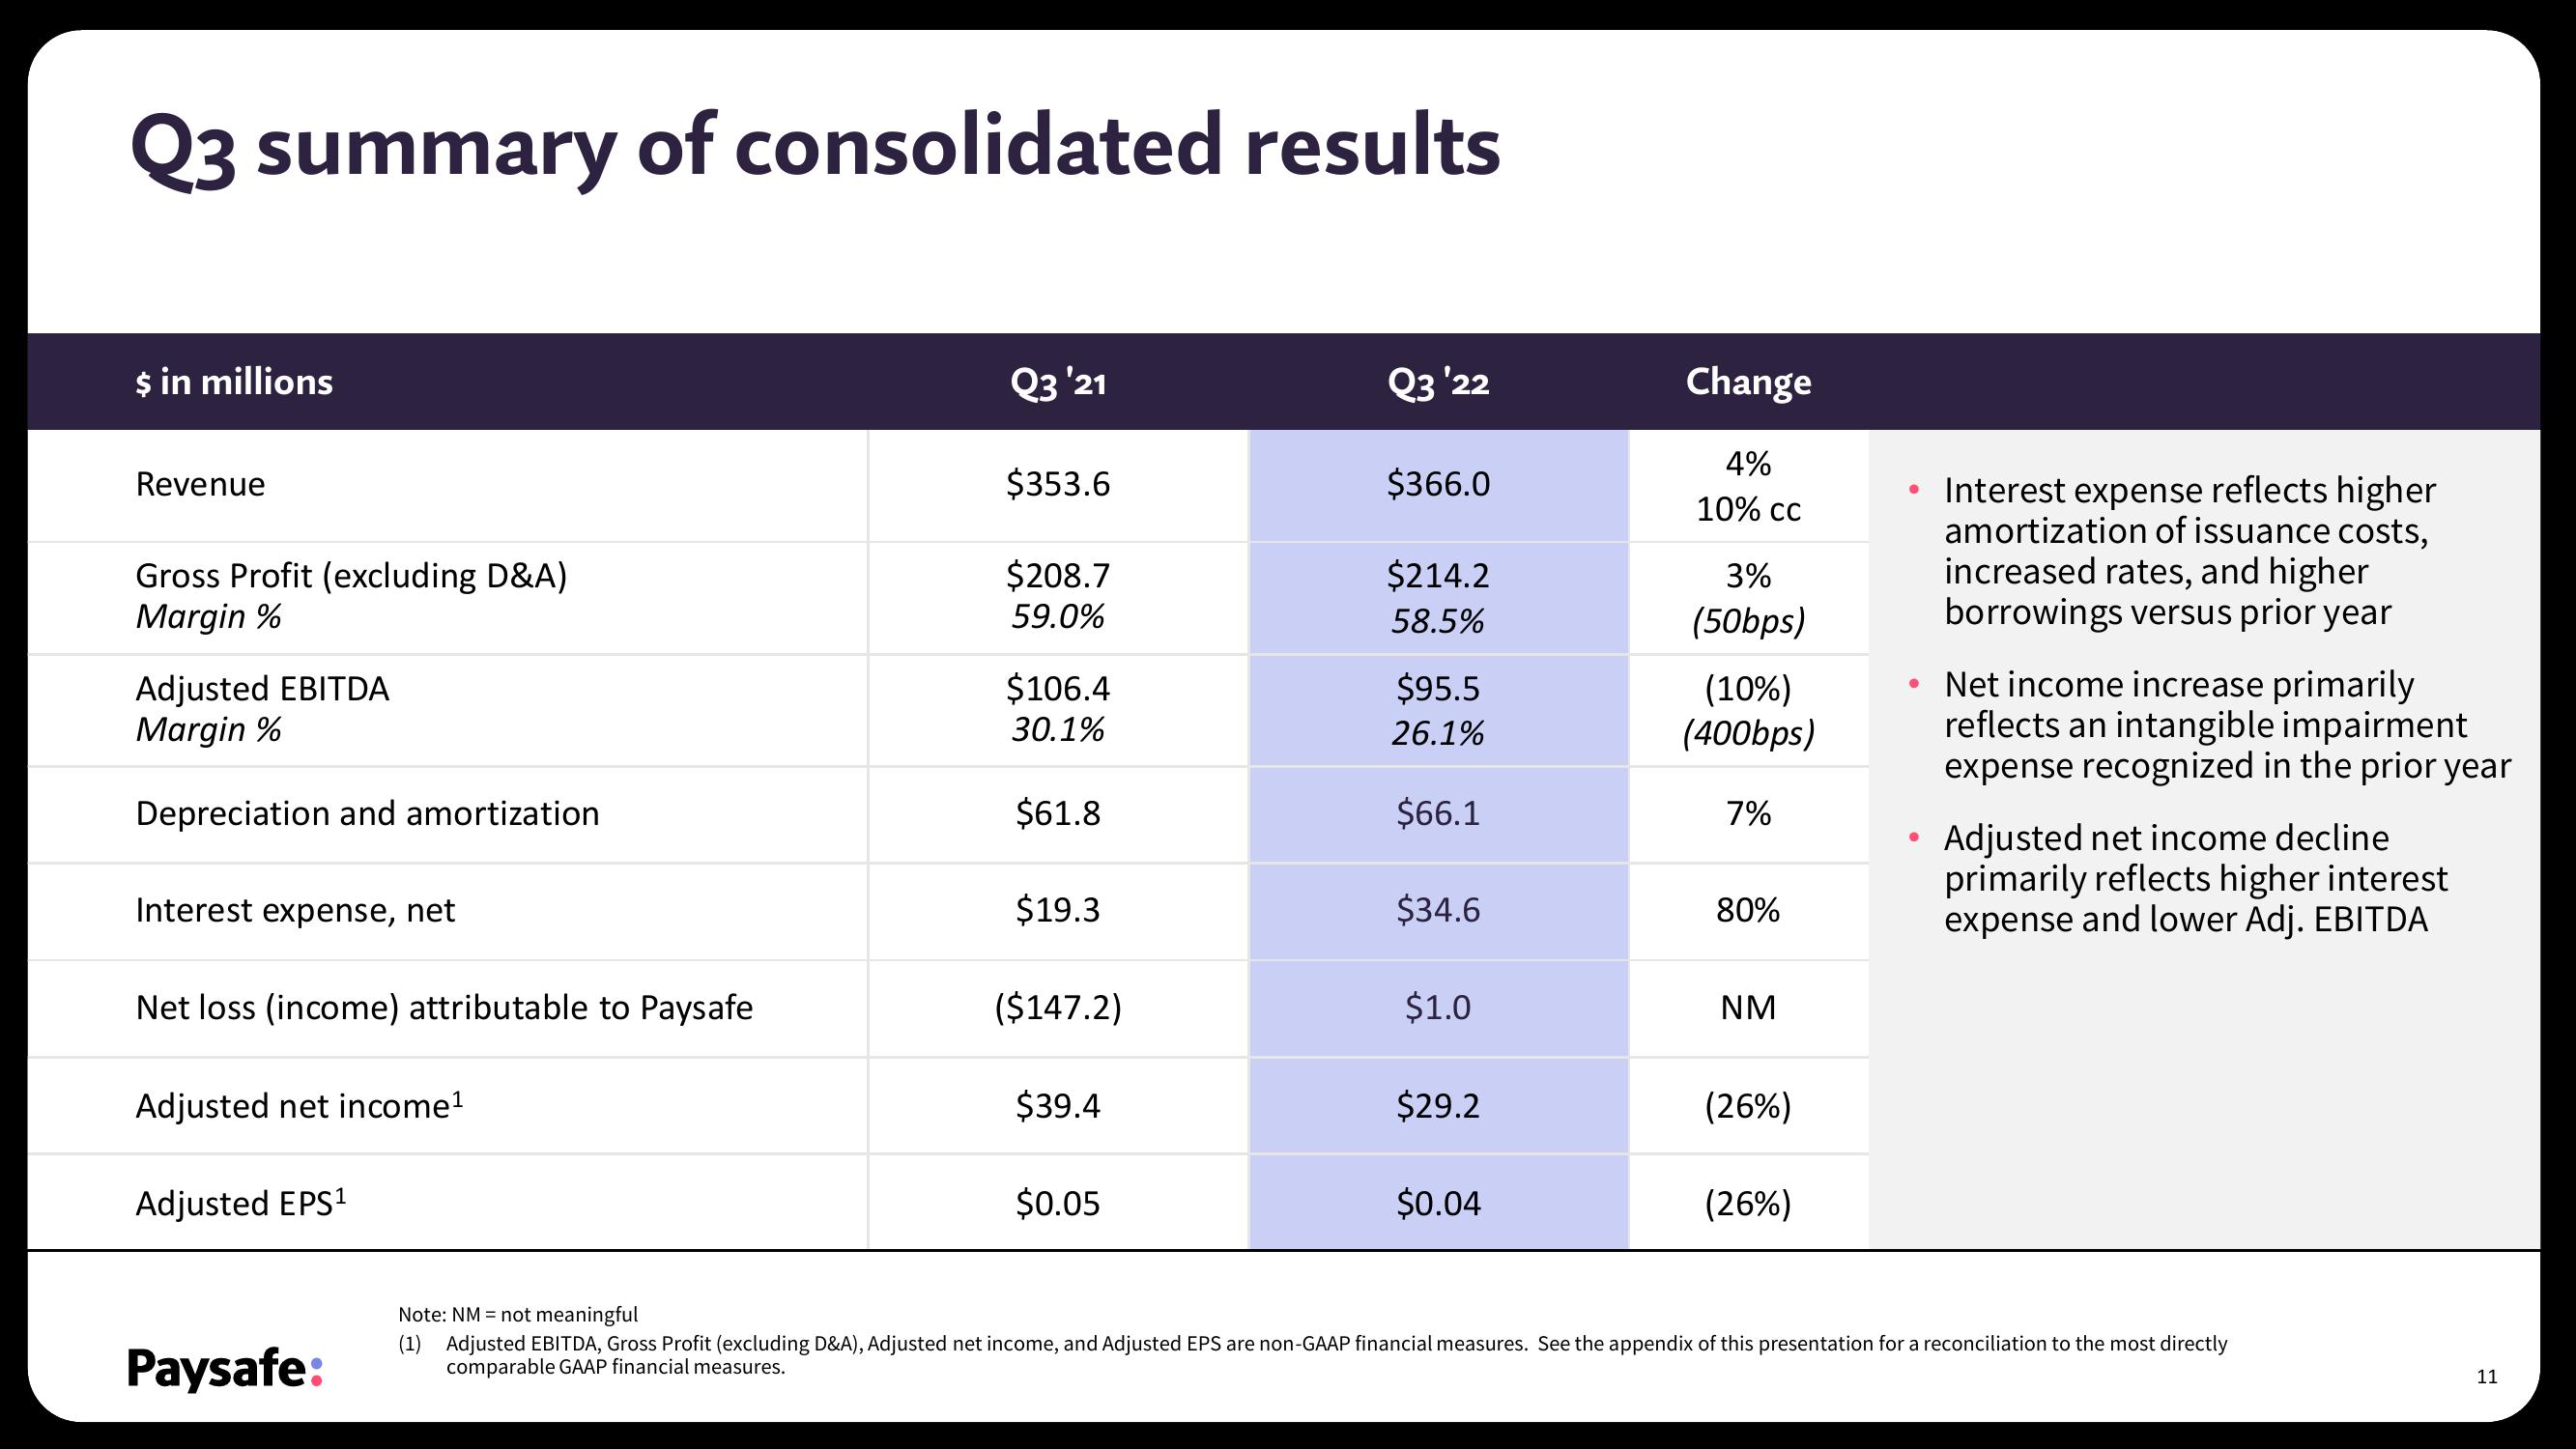
Interest expense reflects higher
amortization of issuance costs,
increased rates, and higher
borrowings versus prior year
Net income increase primarily
reflects an intangible impairment
expense recognized in the prior year
Adjusted net income decline
primarily reflects higher interest
expense and lower Adj. EBITDA
Note: NM = not meaningful
(1) Adjusted EBITDA, Gross Profit (excluding D&A), Adjusted net income, and Adjusted EPS are non-GAAP financial measures. See the appendix of this presentation for a reconciliation to the most directly
comparable GAAP financial measures.
11View entire presentation