Matson Investor Presentation Deck
3
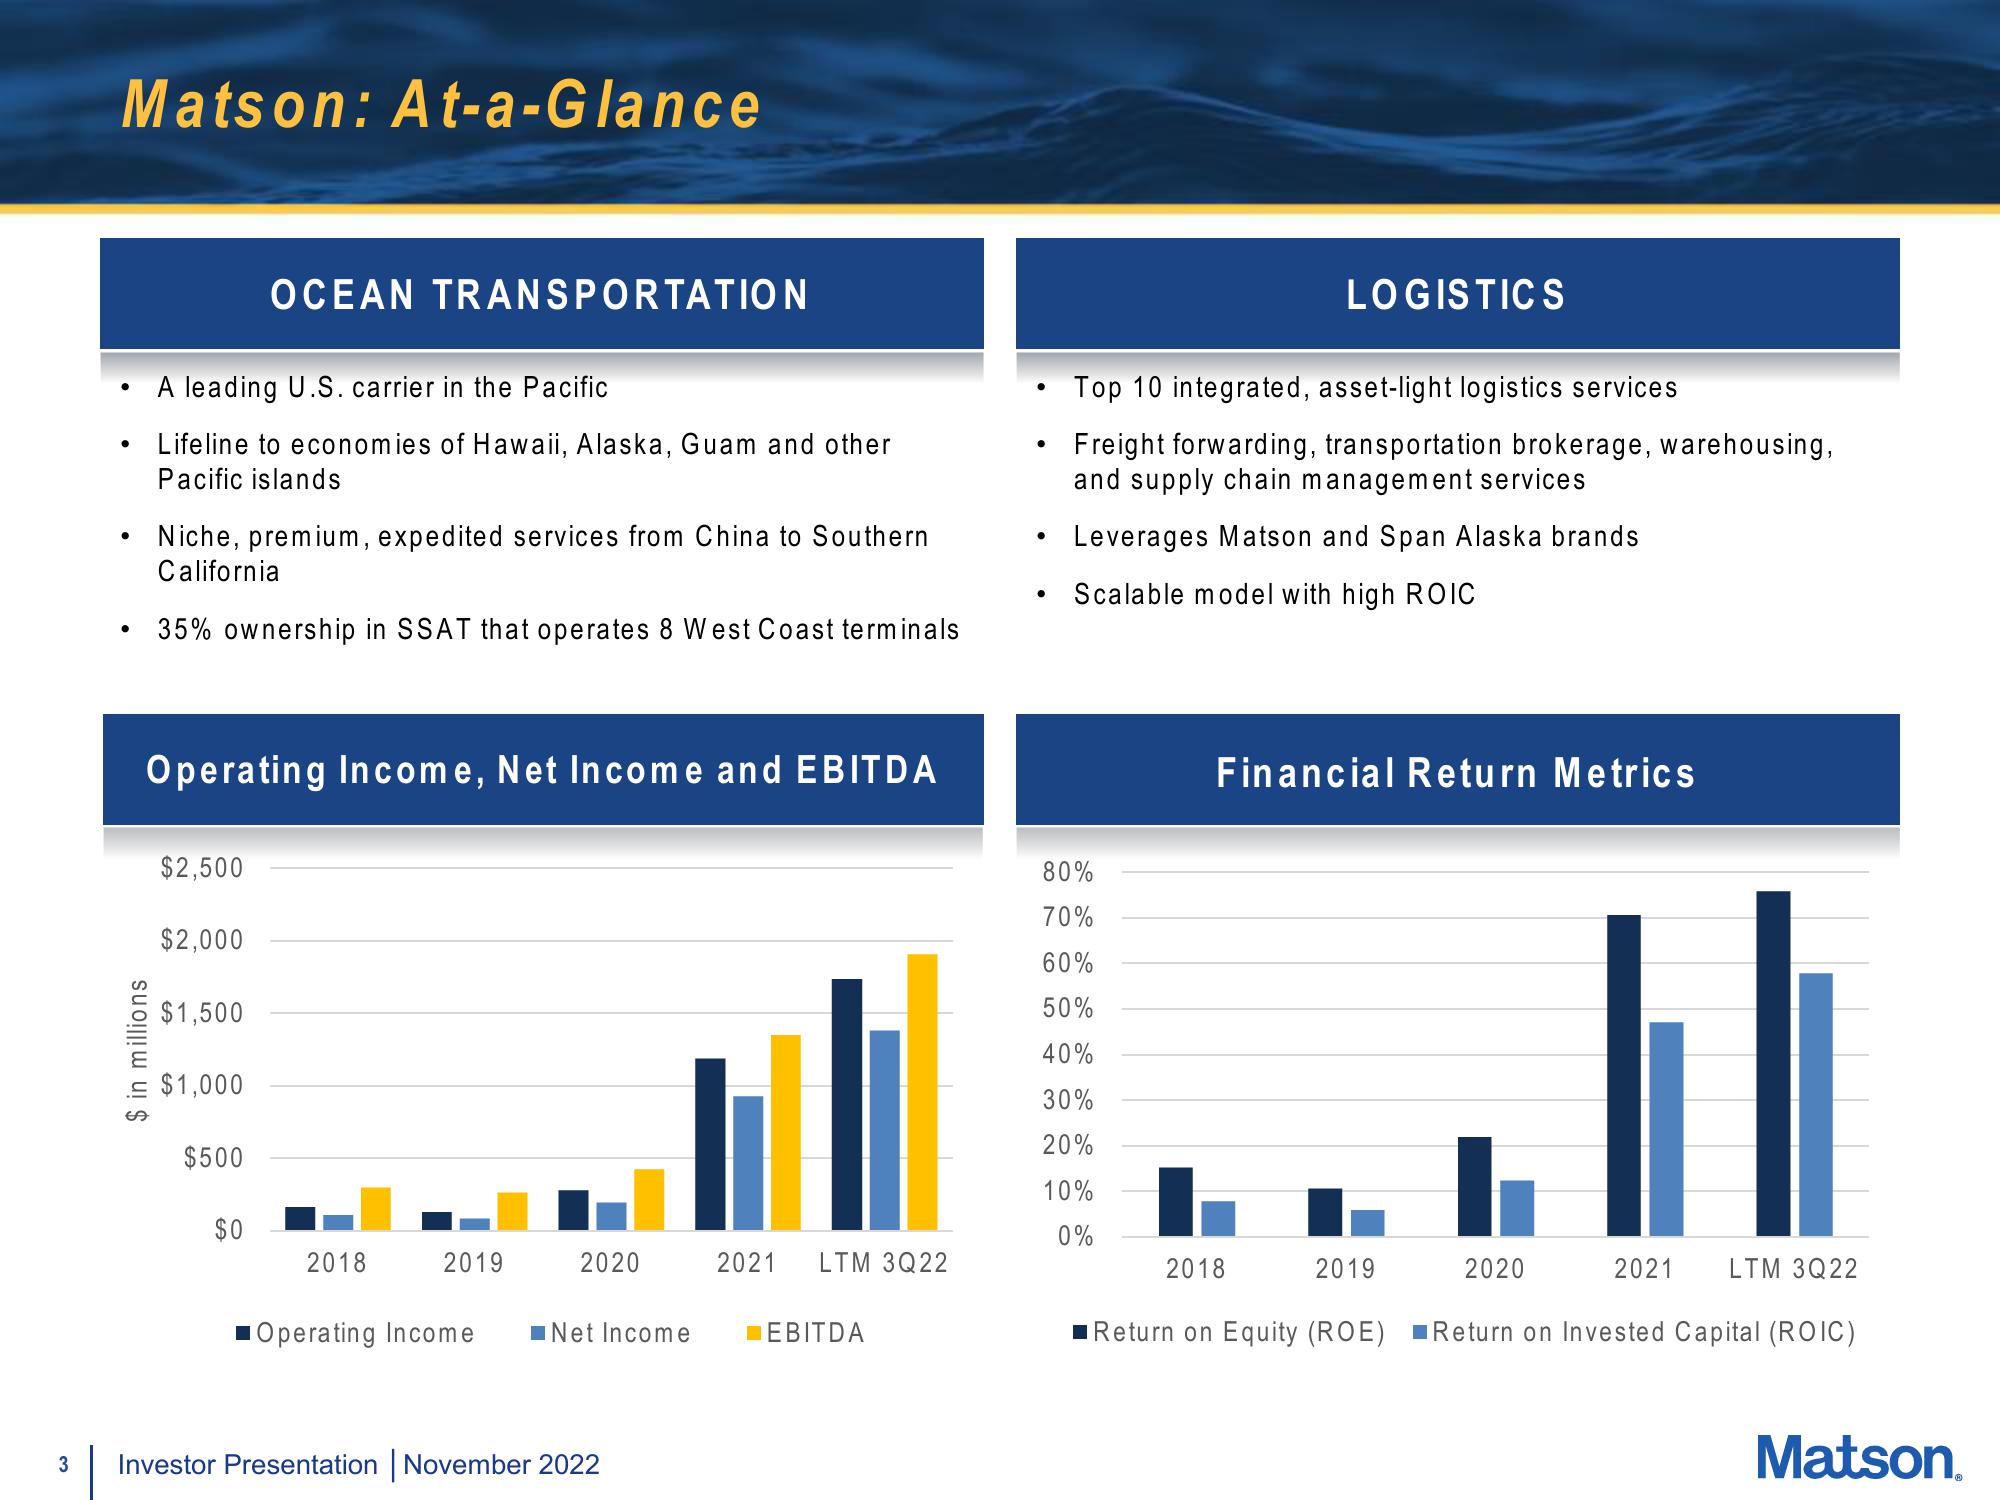
Matson: At-a-Glance
●
●
●
$ in millions
A leading U.S. carrier in the Pacific
Lifeline to economies of Hawaii, Alaska, Guam and other
Pacific islands
Niche, premium, expedited services from China to Southern
California
35% ownership in SSAT that operates 8 West Coast terminals
Operating Income, Net Income and EBITDA
$2,500
$2,000
OCEAN TRANSPORTATION
$1,500
$1,000
$500
$0
2018
2019
2020
ul
Operating Income Net Income
Investor Presentation | November 2022
2021 LTM 3Q22
EBITDA
●
Top 10 integrated, asset-light logistics services
Freight forwarding, transportation brokerage, warehousing,
and supply chain management services
Leverages Matson and Span Alaska brands
Scalable model with high ROIC
80%
70%
60%
50%
40%
30%
20%
10%
0%
LOGISTICS
Financial Return Metrics
2018
2019
2020
||
2021
LTM 3Q22
Return on Equity (ROE) Return on Invested Capital (ROIC)
Matson.View entire presentation